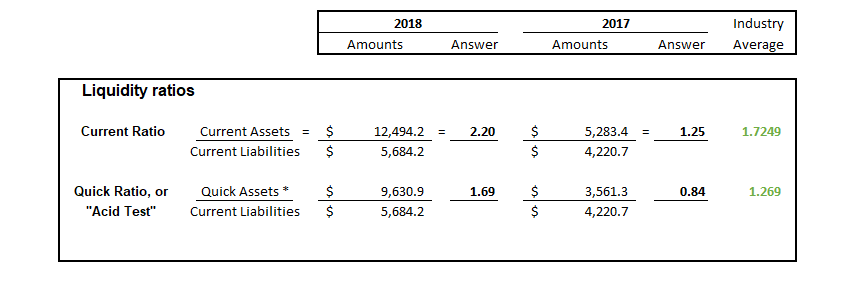
2018 2017 Industry Amounts Answer Amounts Answer Average Liquidity ratios $ Current Ratio 2.20 5,283.4 1.25 Current Assets 12,494.2 1.7249 $ Current Liabilities 5,684.2 4,220.7 Quick Ratio, or Quick Assets 9,630.9 1.69 3,561.3 0.84 1.269 $ $ "Acid Test" Current Liabilities 5,684.2 4,220.7
Q: Carla Vista Co. has these comparative balance sheet data: CARLA VISTA CO. Balance Sheets December…
A: a. Calculate the current ratio:
Q: Problem 5 Jill Corporation's sales, current assets, and current liabilities have been reported as…
A: Trend Index = Current Year / Base Year a)
Q: Disaggregate Traditional DuPont ROE Graphical representations of the KLA-Tencor 2018 income…
A: Hi, as you have posted more than three sub parts, but as per the Bartleby policy we are only able to…
Q: Historical Resolts Forecast Period Balance Sheet 2016 2017 2018 2019 2020 2021 2022 2023 2024 2025…
A: A balance sheet is a financial statement that illustrates a company's assets, liabilities, and…
Q: 3M COMPANY Consolidated Balance Sheets At December 31 ($ millions) Current assets 2018 2017 Cash and…
A: Operating activities are those in which the company’s real operations are affected. It include all…
Q: Finance date of Adams Stores, Inc. for the year ending 2016 and 2017. Items 2016 2017 $3,432,000…
A: Balance sheet: Balance Sheet is one of the financial statements that summarize the assets, the…
Q: Determine flev and spread and the non controling interest ratio(in aplicable) show: ROE=[ROA+(FLEV X…
A: Financial Leverage (FLEV) is financial ratio which represents the relationship between the total…
Q: Short-Term Notes Payable 300 Retained Earnings 2377 Sales Revenue 19385 SG&A Expense 2600 2018 Tax…
A: Income statement shows profit earned or loss incurred by a corporation during an accounting year.
Q: What is the financial analysis of each year?
A: It is given in the question only the liquidity ratios and on that basis only the financial analysis…
Q: ABC Coffee 2018 and 2019 Balance Sheet 2018 2019 2018 2019…
A: Since you have posted a question with multiple sub-parts, we will solve the first three subparts for…
Q: Analysis of Financial Data (Table with ratios) 2021 Est. 2020 Industry Average Ratio Analysis…
A: A thing that is lent, especially an amount of cash that is supposed to be repaid with interest is…
Q: BALANCE SHEET Tenaga National Berhad Inc. Income Statement (in million except per share data, and as…
A: The question is related to the Ratio Analysis. The details are given. Inventory Turnover Ratio =…
Q: Quantitative Problem: Rosnan Industries' 2018 and 2017 balance sheets and income statements are…
A: Disclaimer: "Since you have posted a question with multiple sub-parts, we will solve the first three…
Q: Discuss what the leverage ratios reveal about Starbucks financial health, including any description…
A: Leverage ratio is a financial performance measure. It depicts the amount which has been raised by…
Q: Sunshine Marketing Comparative Statement of Financial Position For the years 2018 and 2019 2018 2019…
A: As per the Answer Sheet given, the Solution is provided in the same format: Statement of…
Q: 2019: Profit Margin – Profit $1435 / Net Sales $38,464 = 0.037:1 OR 3.7% Working Capital – Current…
A:
Q: Computing rate of return on total assets Barot’s 2018 financial statements reported the following…
A: Return on total assets = (Net income + Interest expense) / Average total assets where, Average total…
Q: Discuss what the liquidity ratios reveal about Starbucks financial health, including any description…
A: As per the given information, the current ratio and quick ratio of the firm SB increased in 2018…
Q: Discuss what the profitablility ratios reveal about Starbucks financial health, including any…
A: Profitability ratios are used by investors and analyst to analyze the ability of a business to…
Q: Problem 17-6 (AICPA Adapted) Fearsome Company showed the following comparative statement of…
A: The statement of cash flows can be prepared as follows
Q: COMPANY AUDITED FINANCIAL STATEMENTS 2019 2018 2017 2016 2015 GH¢’000 GH¢’000 GH¢’000…
A: Profitability ratio: These ratios generally used to calculate a company's ability to make a profit…
Q: AE COM LTD Comparative Balance Sheet December 30, 2018 and 2017 2018 2017…
A: Balance sheet: This statement shows the assets and liabilities held by a company on a particular…
Q: Calculate Gillian Pool and Spa Supplies’ average annual compound growth rate of sales, and analyze…
A: Compound annual growth rate on sales measure the growth rate on sales over the specific time period.…
Q: Problem #1 The following balance sheet and income statement data is given: 31-Dec Yr…
A: Ratio analysis helps to analyze the financial statements of the company. The management can take…
Q: ABS GMA Ratio Analysis 2010 2009 2008 2007 2010 2009 2008 2007 Liquidity Management Working capital…
A: Financial ratios are an important source of analyzing the financial statements of a company. These…
Q: Exercise #5 Bronx Company provided the following fnancial statements for the years 2011 and 2012:…
A: For review of liquidity position of the business, cash is very important to be managed. For proper…
Q: Current assets 13,709 15,731 Current ratio 1.89 1.17 Current liabilities 7,244 13,486 Cash +…
A:
Q: Description 4. Using the data for Clorox Company (NYSE: CLX), presented below: Fiscal Year Sales…
A: Annual growth rate It is calculated as shown below. Annual growth rate=Current year valuePreviuos…
Q: COMPANY A RATIO 2019 2018 Liquidity 1 Current Ratio 2 Quick Ratio Profitability 3 ROE 4 ROA 0.67…
A: Ratio analysis is the analysis in which ratios are compared for different periods and companies.
Q: a cash Short term inestmets inven toM Prepaid expenses to tal assets o tal current liabilities…
A: Total Current assets = AR + Cash + short term investment + inventory + prepaid expenses Total…
Q: Balance Sheets At December 31 2018 2017 2018 2017 Assets: $ 24,640 $ 23,040 32,180 73,125 55,900…
A: Cash Flow Statement is the part of Financial Statement which shows the net increase/decrease in Cash…
Q: working capital management of the company for 2018 using the following data. Wh 2018 Recelvable…
A: The accounts receivable turnover ratio or debtor’s turnover ratio, is a ratio that measures how…
Q: Calculate the following ratios for the period 2015-2019 from the financial statements given above.…
A: Gearing Ratio= Long term Debt+ Short Term Debt/ Shareholder’s Equity or, D/E
Q: Comment on the changes between these two years. What do the changes in ROA mean?
A: The amount of returns which is calculated by the company by dividing the annual net income that is…
Q: THE COMPANY'S FINANCIAL RATIO ANALYSIS a. Liquidity Ratio Liquidity Ratio: Year 2016 2017 2018 2019…
A: Disclaimer: “Since you have asked multiple questions, we will solve the first question for you. If…
Q: Organization's Name: Sloan Kettering (in ,000's) Fin Statement Field 2016 2015 Benefit Expense Cash…
A: The question is related to Cash Flow Statement. The Cash Flow Statement is a Statement of Cash…
Q: LIABILITIES 2014 2013 Current liabilities Accounts payable %24 74,305 $ 66,268 Short-term debt 229 $…
A: 2012 Total current liabilities = 66268+165 = 66433 Total liabilities = 66433 + 185073 + 20262 =…
Q: KORBIN COMPANY Comparative Balance Sheets December 31, 2019, 2018, and 2017 2019 2018 2017 Assets…
A: We have the following information:
Q: [Question 1] Saturn Company Comparative Balance Sheet 2018 2017 Assets Cash Accounts Recelvable…
A: The Balance Sheets of a company are given for the year ended 2017 and 2018. Required Prepare Cash…
Q: ANDY LIM TRADING Statement of Financial Position As of Decenber 31 Assets 2017 2016 Increase…
A: Horizontal Analysis: It is a statement showing the amount and percent changes in the items of the…
Q: 2018 35,000 30,000 118,000 240,000 22,000 SS0,000 207,000 a cash Short 2017 S2,000 15,000 135,000…
A: Total Current assets = AR + Cash + short term investment + inventory + prepaid expenses Total…
Q: Filling in the missing values
A: Step1: Calculating the value of account payable for the year 2017. We have,Free Cash Flow = Earnings…
Define
Trending now
This is a popular solution!
Step by step
Solved in 2 steps
- Use the below information to answer the following questions: 20202021Sales$11,573$12,936Depreciation 1661 1736Cost of goods sold 3979 4707Other Expenses 846 924Interest Expense 776 926Cash 6067 6466Accounts Receivables 8034 9427Short-term Notes Payable 1171 1147Long-term debt 20,320 24,696Net fixed assets 50,888 54,273Accounts Payable 4384 4644Tax rate 26% 34%Inventory 14,283 15,288Payout ratio 33% 30% A. Create the Balance Sheets for 2020 & 2021.Use the below information to answer the following questions: 20202021Sales$11,573$12,936Depreciation 1661 1736Cost of goods sold 3979 4707Other Expenses 846 924Interest Expense 776 926Cash 6067 6466Accounts Receivables 8034 9427Short-term Notes Payable 1171 1147Long-term debt 20,320 24,696Net fixed assets 50,888 54,273Accounts Payable 4384 4644Tax rate 26% 34%Inventory 14,283 15,288Payout ratio 33% 30% A. Create the Income Statements for 2020 and 2021 (including dividends paid and retained earnings).E23.10B (L0 1,4) (Classification of Transactions) Following are selected balance sheet accounts of BioLazer Corp. at December 31, 2020 and 2019, and the increases or decreases in each account from 2019 to 2020. Also presented is selected income statement information for the year ended December 31, 2020, and additional information. Increase Selected balance sheet accounts 2020 2019 (Decrease)AssetsAccounts receivable $154,000 $120,000 $34,000Property, plant, and equipment 631,000 581,000 50,000Accumulated…
- Industry Financial Ratios (2019)Quick ratio 1.0Current ratio 2.7Inventory turnover 7.0Total assets turnover 2.6Return on assets 9.1%Return on equity 18.2%Debt ratio 50.0%Gross Profit margin 20%Net Profit margin 3.5%P/E ratio 6.0RequiredCalculate Walton’s 2019 ratios, interpret and compare them with the industry averagedata, and comment briefly on Walton’s strengths and weaknesses.GIVE THE COMPARATIVE BALANCE SHEET VERTICAL ANALYSIS FROM THE GIVEN BALANCE SHEET BELOW JOLLIBEE BALANCE SHEET ASSETS ITEM 2016 2017 2018 2019 2020 Cash & Short Term Investments 17.46B 22.52B 24.17B 23.02B 57.46B Cash & Short Term Investments Growth - 28.99% 7.32% -4.75% 149.59% Cash Only 16.73B 21.11B 23.29B 20.89B 21.36B Short-Term Investments 726M 1.41B 883.2M 2.13B 36.1B Cash & ST Investments / Total Assets 23.96% 25.08% 16.06% 12.28% 27.26% Total Accounts Receivable 3.59B 4.02B 4.86B 5.91B 7.05B Total Accounts Receivable Growth - 11.86% 21.04% 21.46% 19.36% Accounts Receivables, Net 3.03B 3.39B 4.41B 5.37B 5.8B Accounts Receivables, Gross 3.61B 4.08B 5.09B 5.76B 6.46B Bad Debt/Doubtful Accounts (579.79M) (690.12M) (676.91M) (392.36M) (658.63M) Other Receivable 562.75M 630.06M 451.73M 536.62M 1.25B…GIVE THE COMPARATIVE BALANCE SHEET HORIZONTAL ANALYSIS FROM THE GIVEN BALANCE SHEET BELOW JOLLIBEE BALANCE SHEET ASSETS ITEM 2016 2017 2018 2019 2020 Cash & Short Term Investments 17.46B 22.52B 24.17B 23.02B 57.46B Cash & Short Term Investments Growth - 28.99% 7.32% -4.75% 149.59% Cash Only 16.73B 21.11B 23.29B 20.89B 21.36B Short-Term Investments 726M 1.41B 883.2M 2.13B 36.1B Cash & ST Investments / Total Assets 23.96% 25.08% 16.06% 12.28% 27.26% Total Accounts Receivable 3.59B 4.02B 4.86B 5.91B 7.05B Total Accounts Receivable Growth - 11.86% 21.04% 21.46% 19.36% Accounts Receivables, Net 3.03B 3.39B 4.41B 5.37B 5.8B Accounts Receivables, Gross 3.61B 4.08B 5.09B 5.76B 6.46B Bad Debt/Doubtful Accounts (579.79M) (690.12M) (676.91M) (392.36M) (658.63M) Other Receivable 562.75M 630.06M 451.73M 536.62M 1.25B…
- QWC 2016 $000 2017 $000 2018 $000 2019 $000 2020 $000 2021 $000 Current ratio 0.66 0.58 0.96 0.92 1.06 0.83 Quick ratio 0.43 0.37 0.58 0.53 0.49 0.57 Operating cash flow ratio 0.10 0.01 0.01 0.00 0.02 0.07 MMC Current ratio 2.37 2.23 2.07 1.89 2.74 2.16 Quick ratio 0.93 0.95 0.81 0.80 1.36 1.01 Operating cash flow ratio 1.02 0.72 0.96 0.47 0.32 0.52 Please interpret the ratio for both the companies. Not required to explain the theory just interpret the values for the following: 1) Current Ratio 2) Quick Ratio 3) Operating cash flow ratioE10.18 (LO 5), AN Suppose the following financial data were reported by 3M Company for 2021 and 2022 (dollars in millions). 3M CompanyBalance Sheets (partial) 2022 2021 Current assets Cash and cash equivalents $ 3,040 $1,849 Accounts receivable, net 3,250 3,195 Inventories 2,639 3,013 Other current assets 1,866 1,541 Total current assets $10,795 $9,598 Current liabilities $ 4,897 $5,839 Instructions Calculate the current ratio and working capital for 3M for 2021 and 2022. Suppose that at the end of 2022, 3M management used $300 million cash to pay off $300 million of accounts payable. How would its current ratio and working capital have changed?GIVE THE COMPARATIVE BALANCE SHEET HORIZONTAL AND VERTICAL ANALYSIS FROM THE GIVEN BALANCE SHEET BELOW JOLLIBEE BALANCE SHEET ASSETS ITEM 2016 2017 2018 2019 2020 Cash & Short Term Investments 17.46B 22.52B 24.17B 23.02B 57.46B Cash & Short Term Investments Growth - 28.99% 7.32% -4.75% 149.59% Cash Only 16.73B 21.11B 23.29B 20.89B 21.36B Short-Term Investments 726M 1.41B 883.2M 2.13B 36.1B Cash & ST Investments / Total Assets 23.96% 25.08% 16.06% 12.28% 27.26% Total Accounts Receivable 3.59B 4.02B 4.86B 5.91B 7.05B Total Accounts Receivable Growth - 11.86% 21.04% 21.46% 19.36% Accounts Receivables, Net 3.03B 3.39B 4.41B 5.37B 5.8B Accounts Receivables, Gross 3.61B 4.08B 5.09B 5.76B 6.46B Bad Debt/Doubtful Accounts (579.79M) (690.12M) (676.91M) (392.36M) (658.63M) Other Receivable 562.75M 630.06M 451.73M…
- Use the common-size financial statements found here: ommon-Size Balance Sheet 2016Cash and marketable securities $ 480 1.5 %Accounts receivable 6,030 18.2Inventory 9,540 28.8Total current assets $ 16,050 48.5 %Net property, plant, and equipment 17,020 51.5Total assets $33,070 100.0 %Accounts payable $ 7,150 21.6 %Short-term notes 6,850 20.7Total current liabilities $ 14,000 42.3 %Long-term liabilities 7,010 21.2Total liabilities $ 21,010 63.5 %Total common shareholders’ equity 12,060 36.5Total liabilities and shareholders’ equity $33,070 100.0 %Common-Size Income Statement 2016Revenues $ 30,000 100.0 %Cost of goods sold (20,050) 66.8Gross profit $ 9,950 33.2 %Operating expenses (7,960) 26.5Net operating income $ 1,990 6.6 %Interest expense (940) 3.1Earnings before taxes $ 1,050 3.5 %Income taxes (382) 1.3Net income $668 2.2 % Specifically, write up a brief narrative that responds to the following questions: a. How much cash does Patterson have on hand relative to its total…Return on total assets ratio: net income/ average total assets 21,331/(321,195+225,248)/2= 0.07807= 7.8% (2020 year) 11588/(162,648+225,248)/2= 0.059= 6.0% (2019 year) Write financial analysis report.Xyz tradingCondensed comparative balance sheet 2021 2020 2019Assets:Current assets 468,000. 345,600. 300,000Property and equipment 600,000. 560,400. 500,400Other assets(advances ). 72,000. 126,000. 150,000Total assets. 1,140,000. 1,032,000. 950,400Liabilities and stockholders’ equityLiabilitiesCurrent liabilities 134,400. 112,800. 100,00012 % long-term notes payable. 240,000. 300,000 350,000Total liabilities. 374,400. 412,800. 450,000Stockholders’ equity10% preferred stock 120,000. 120,000. 120,000Common stock 300,000 240,000 200,000Additional paid in capital 84,000. 48,000 40,000Retained earnings…