
Elementary Geometry For College Students, 7e
7th Edition
ISBN:9781337614085
Author:Alexander, Daniel C.; Koeberlein, Geralyn M.
Publisher:Alexander, Daniel C.; Koeberlein, Geralyn M.
ChapterP: Preliminary Concepts
SectionP.CT: Test
Problem 1CT

Related questions
Question
Transcribed Image Text:K Miguel FrancoPresinal - Level 2
A W39 #176 Level 2 Area of Comp X
K Miguel FrancoPresinal - Level 2 X
b My Questions | bartleby
+
A web.kamihq.com/web/viewer.html?state=%7B"ids"%3A%5B"1u8MylK-XNh7f1hbKMepV39P_54epQGxe"%5D%2C"action"%3A"open"%2C"userld"%3A"108.
A Classes
M Inbox - 26mifranco..
Bb Reynolds Middle Sc.
C Clever | Teacher Pa.
R Kami
O Sora
O (2124) YouTube O Home
E Monday's half day.
* What is the circumf.
E Reading list
Kami Student Edu O
O A 7th 1/2 20-21 . Miguel FrancoPresinal - Level 2 Area of Composite Figure: Saved |DUndo
A Turn In
410%
MF
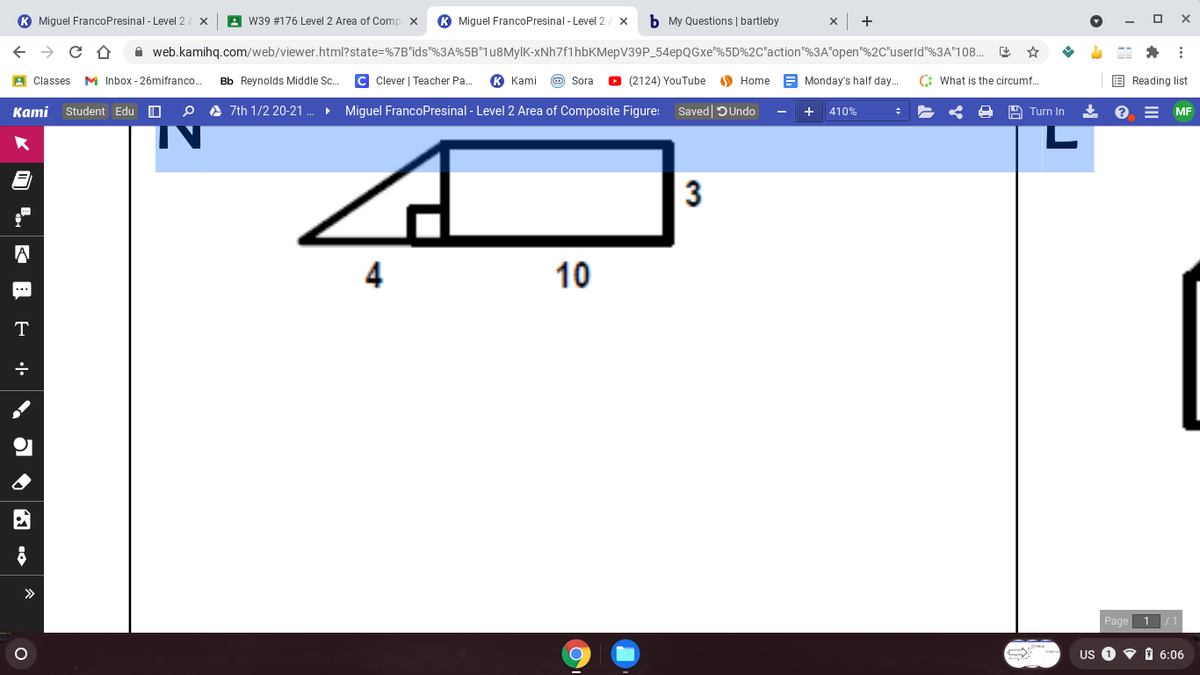
4
10
T
>>
Page
1
Us O V 6:06
3.
Transcribed Image Text:K Miguel FrancoPresinal - Level 2
A W39 #176 Level 2 Area of Comp x
K Miguel FrancoPresinal - Level 2 X
b My Questions | bartleby
+
A web.kamihq.com/web/viewer.html?state=%7B"ids"%3A%5B"1u8MylK-XNh7f1hbKMepV39P_54epQGxe"%5D%2C"action"%3A"open"%2C"userld"%3A"108.
A Classes
M Inbox - 26mifranco.
Bb Reynolds Middle Sc.
C Clever | Teacher Pa.
R Kami
O Sora
O (2124) YouTube O Home
E Monday's half day.
* What is the circumf.
E Reading list
Kami Student Edu O
O A 7th 1/2 20-21 . Miguel FrancoPresinal - Level 2 Area of Composite Figure: Saved |DUndo
+
A Turn In
430%
MF
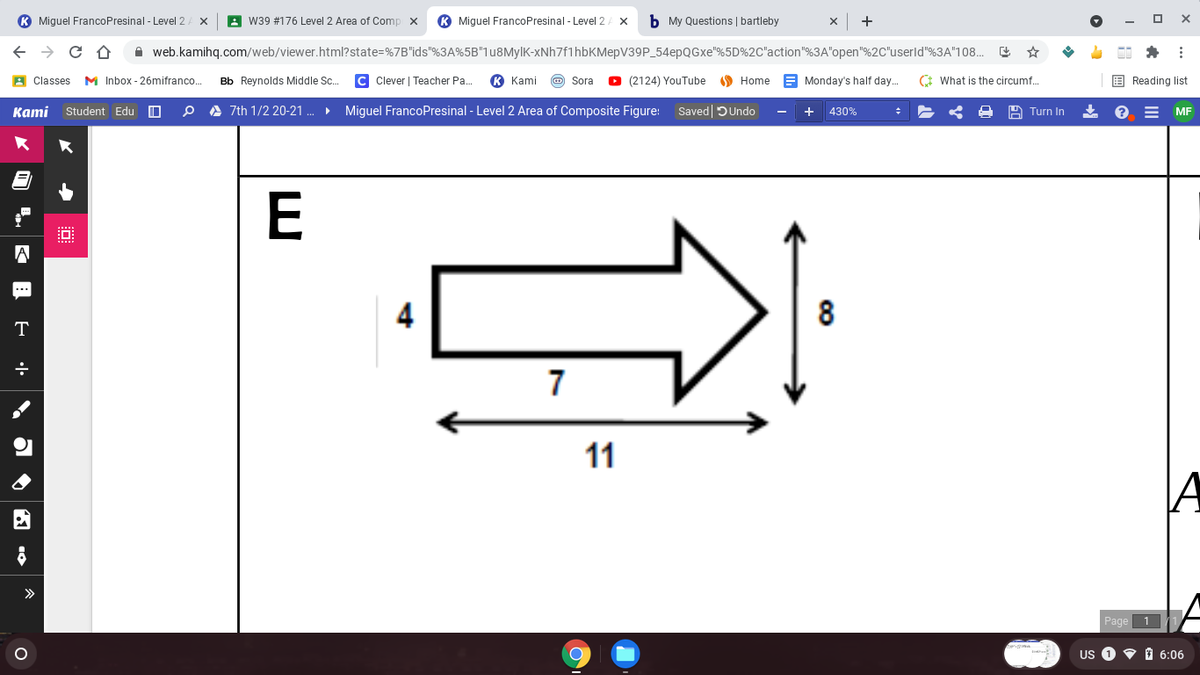
E
8
T
7
11
>>
Page
1
Us 0 V P 6:06
•l•
Expert Solution
This question has been solved!
Explore an expertly crafted, step-by-step solution for a thorough understanding of key concepts.

Step by step
Solved in 2 steps with 4 images

Knowledge Booster


Learn more about
Need a deep-dive on the concept behind this application? Look no further. Learn more about this topic, geometry and related others by exploring similar questions and additional content below.Recommended textbooks for you
Elementary Geometry For College Students, 7e
Geometry
ISBN:
9781337614085
Author:
Alexander, Daniel C.; Koeberlein, Geralyn M.
Publisher:
Cengage,

Elementary Geometry for College Students
Geometry
ISBN:
9781285195698
Author:
Daniel C. Alexander, Geralyn M. Koeberlein
Publisher:
Cengage Learning
Elementary Geometry For College Students, 7e
Geometry
ISBN:
9781337614085
Author:
Alexander, Daniel C.; Koeberlein, Geralyn M.
Publisher:
Cengage,
Elementary Geometry for College Students
Geometry
ISBN:
9781285195698
Author:
Daniel C. Alexander, Geralyn M. Koeberlein
Publisher:
Cengage Learning