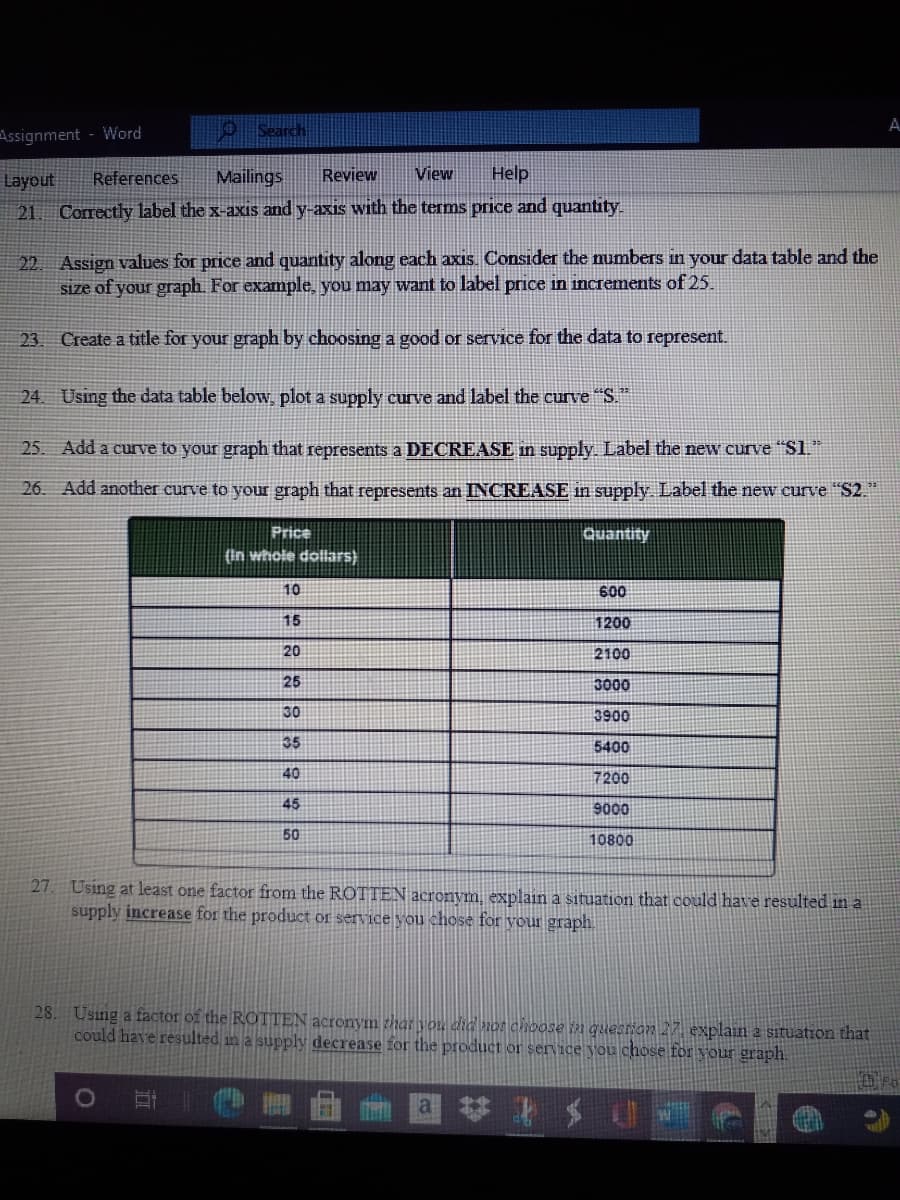
21 Correctly label the x-axis and y-axis with the terms price and quantity. 22. Assign values for price and quantity along each axis. Consider the numbers in your data table and the size of your graph. For example, you may want to label price in increments of 25. 23. Create a title for your graph by choosing a good or service for the data to represent. 24. Using the data table below, plot a supply curve and label the curve "S. 25. Add a curve to your graph that represents a DECREASE in supply. Label the new curve "Sl." 26. Add another curve to your graph that represents an INCREASE in supply Label the new curve "S2." Price Quantity (In whole dollars) 10 600 15 1200 20 2100 25 3000 30 3900 35 5400 40 7200 45 9000 50 10800 27. Using at least one factor from the ROTTEN acronym, explain a situation that could have resulted in a supply increase for the product or service you chose for your graph 28. Using a factor of the ROTTEN acronym thar you dic nor choose n question 27 explain a situation that could have resulted in a supply decrease for the product or service you chose for your graph
21 Correctly label the x-axis and y-axis with the terms price and quantity. 22. Assign values for price and quantity along each axis. Consider the numbers in your data table and the size of your graph. For example, you may want to label price in increments of 25. 23. Create a title for your graph by choosing a good or service for the data to represent. 24. Using the data table below, plot a supply curve and label the curve "S. 25. Add a curve to your graph that represents a DECREASE in supply. Label the new curve "Sl." 26. Add another curve to your graph that represents an INCREASE in supply Label the new curve "S2." Price Quantity (In whole dollars) 10 600 15 1200 20 2100 25 3000 30 3900 35 5400 40 7200 45 9000 50 10800 27. Using at least one factor from the ROTTEN acronym, explain a situation that could have resulted in a supply increase for the product or service you chose for your graph 28. Using a factor of the ROTTEN acronym thar you dic nor choose n question 27 explain a situation that could have resulted in a supply decrease for the product or service you chose for your graph

Principles of Economics 2e
2nd Edition
ISBN:9781947172364
Author:Steven A. Greenlaw; David Shapiro
Publisher:Steven A. Greenlaw; David Shapiro
Chapter3: Demand And Supply
Section: Chapter Questions
Problem 39CTQ: Consider the demand for hamburgers. If the price of a substitute good (for example, hot dogs)...

Related questions
Question
I need help making this into a graph
Transcribed Image Text:A.
Assignment - Word
Search
Layout
References
Mailings
Review
View
Help
21 Correctlv label the x-axis and y-axis with the terms price and quantıty.
22 Assign values for price and quantity along each axis. Consider the numbers in your data table and the
size of your graph. For example, you may want to label price in increments of 25.
23. Create a title for your graph by choosing a good or service for the data to represent.
24. Using the data table below, plot a supply curve and label the curve "S."
25. Add a curve to your graph that represents a DECREASE in supply. Label the new curve "Sl."
26. Add another curve to your graph that represents an INCREASE in supply Label the new curve "S2."
Price
Quantity
(in whole dollars)
10
600
15
1200
20
2100
25
3000
30
3900
35
5400
40
7200
45
9000
50
10800
27 Using at least one factor from the ROTTEN acronym, explain a situation that could have resulted in a
supply increase for the product or service you chose for your graph
28. Using a factor of the ROTTEN acronym that vou did nor choose in question 27 explain a situation that
could have resulted in a supply decrease for the product or service you chose for your graph.
nsts回
Expert Solution
This question has been solved!
Explore an expertly crafted, step-by-step solution for a thorough understanding of key concepts.

This is a popular solution!

Trending now
This is a popular solution!

Step by step
Solved in 2 steps with 1 images

Recommended textbooks for you
Principles of Economics 2e
Economics
ISBN:
9781947172364
Author:
Steven A. Greenlaw; David Shapiro
Publisher:
OpenStax

Principles of Economics 2e
Economics
ISBN:
9781947172364
Author:
Steven A. Greenlaw; David Shapiro
Publisher:
OpenStax