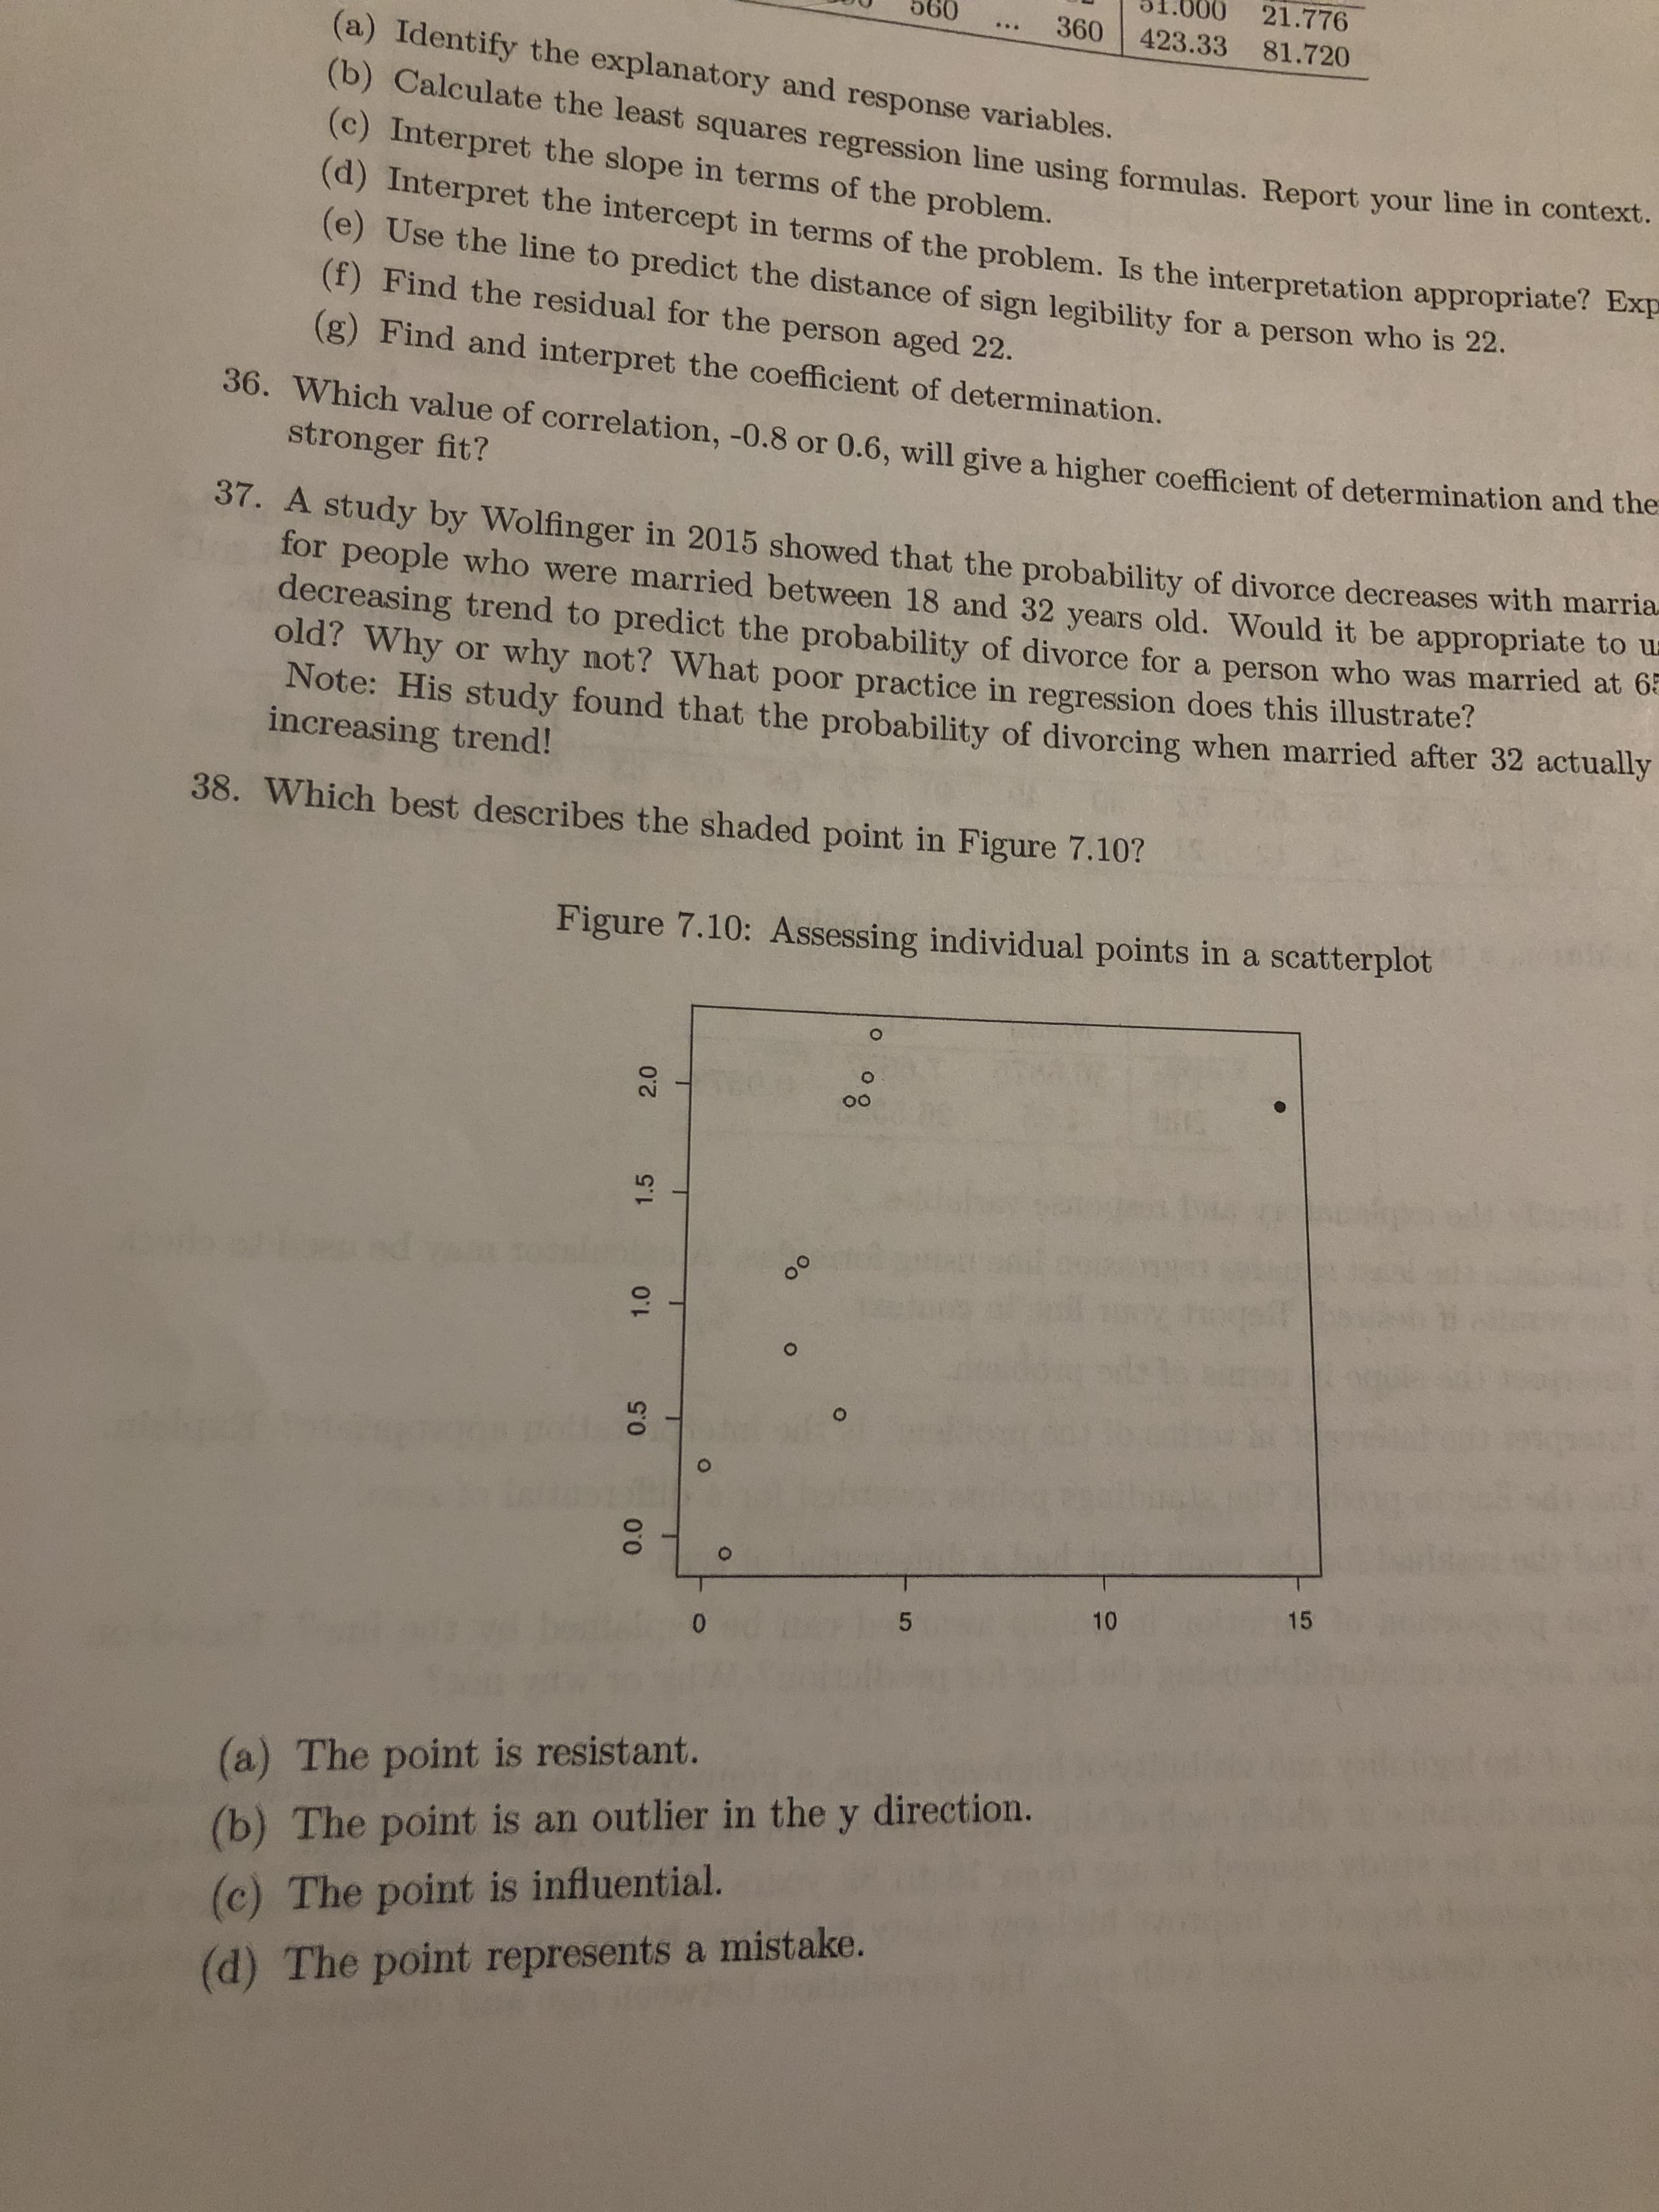
21.776 423.33 81.720 090 360 ... (a) Identify the explanatory and response variables. (b) Calculate the least squares regression line using formulas. Report your line in context. (c) Interpret the slope in terms of the problem. (d) Interpret the intercept in terms of the problem. Is the interpretation appropriate? Exp (e) Use the line to predict the distance of sign legibility for a person who is 22. (f) Find the residual for the person aged 22. (g) Find and interpret the coefficient of determination. 36. Which value of correlation, -0.8 or 0.6, will give a higher coefficient of determination and the stronger fit? 37. A study by Wolfinger in 2015 showed that the probability of divorce decreases with marria. for people who were married between 18 and 32 years old. Would it be appropriate to u decreasing trend to predict the probability of divorce for a person who was married at be old? Why or why not? What poor practice in regression does this illustrate? Note: His study found that the probability of divorcing when married after 32 actually increasing trend! 38. Which best describes the shaded point in Figure 7.10? Figure 7.10: Assessing individual points in a scatterplot 00 15 10 (a) The point is resistant. (b) The point is an outlier in the y direction. (c) The point is influential. (d) The point represents a mistake. 0.0 0.5 1.0 1.5 2.0


Addition Rule of Probability
It simply refers to the likelihood of an event taking place whenever the occurrence of an event is uncertain. The probability of a single event can be calculated by dividing the number of successful trials of that event by the total number of trials.
Expected Value
When a large number of trials are performed for any random variable ‘X’, the predicted result is most likely the mean of all the outcomes for the random variable and it is known as expected value also known as expectation. The expected value, also known as the expectation, is denoted by: E(X).
Probability Distributions
Understanding probability is necessary to know the probability distributions. In statistics, probability is how the uncertainty of an event is measured. This event can be anything. The most common examples include tossing a coin, rolling a die, or choosing a card. Each of these events has multiple possibilities. Every such possibility is measured with the help of probability. To be more precise, the probability is used for calculating the occurrence of events that may or may not happen. Probability does not give sure results. Unless the probability of any event is 1, the different outcomes may or may not happen in real life, regardless of how less or how more their probability is.
Basic Probability
The simple definition of probability it is a chance of the occurrence of an event. It is defined in numerical form and the probability value is between 0 to 1. The probability value 0 indicates that there is no chance of that event occurring and the probability value 1 indicates that the event will occur. Sum of the probability value must be 1. The probability value is never a negative number. If it happens, then recheck the calculation.
Question 38


Trending now
This is a popular solution!

Step by step
Solved in 2 steps


