287 PROBLEMS 5.1 algebra according to a new method. Find a 90% confidence interval for the difference in achievement scores expected from the two methods. Students' Achievement Scores 80 78 ১), and Method ledger, 84 69 79 72 68 Present 70 72 73 68 (1975). 60 64 New girls, with the following observed weight losses. Find a 90% confidence interval for mean difference in effectiveness of the two diets. Diet A was given to four overweight girls and diet B was given to five other overweight 96ाळ), 1953). Kean 4. AREYER Weight Losses (pounds) 7, 2, -1, 4 6, 5, 2, 8, 3 Diet dges A itzer В telescopic sight improves the ability to hit a target under twilight conditions. Group A is group 972), 5. Eight volunteers for an experiment are divided randomly into two groups, to see if a given sights. After a learning period they are given a shooting test at twilight. These are their B has the same kind of rifle but with open rifles with telescopic sights, while scores (100 is perfect). 85 88 Group A: Group B: 93 96 77 80 83 89 an in up What do you conclude? 6. a wooded area, and a team of observers is sent out to find them. The team reports the distance at which they first sight each tent (true sightings only) until all 20 tents are found. The purpose of the study is to determine whether the patterned camouflage is more difficult to detect than the plain camouflage. The distances at which each tent is detected are Ten tents using plain camouflage and 10 tents using patterned camouflage are set as follows. reported Distance (meters) 25, 28, 16, 34, 38, 21, 29, 43, 32, 36 26, 12, 16, 21, 20, 14, 10, 18, 22, 20 Type of camouflage Plain Patterned (a) Perform a hypothesis test. (b) Find a nonparametric 95% confidence interval for the difference in mean detection distances. eT PROBLEMS 1. Let Note that there are mn pairs in all. Show that S and T satisfy the relationship equal the number of pairs (X, Y) in which Xi exceeds Y (counting ties as one-half). S =T-n(n + 1) 2 n(n+ 1) What statistic seems reasonable to use as an estimate of P(X> Y)?
287 PROBLEMS 5.1 algebra according to a new method. Find a 90% confidence interval for the difference in achievement scores expected from the two methods. Students' Achievement Scores 80 78 ১), and Method ledger, 84 69 79 72 68 Present 70 72 73 68 (1975). 60 64 New girls, with the following observed weight losses. Find a 90% confidence interval for mean difference in effectiveness of the two diets. Diet A was given to four overweight girls and diet B was given to five other overweight 96ाळ), 1953). Kean 4. AREYER Weight Losses (pounds) 7, 2, -1, 4 6, 5, 2, 8, 3 Diet dges A itzer В telescopic sight improves the ability to hit a target under twilight conditions. Group A is group 972), 5. Eight volunteers for an experiment are divided randomly into two groups, to see if a given sights. After a learning period they are given a shooting test at twilight. These are their B has the same kind of rifle but with open rifles with telescopic sights, while scores (100 is perfect). 85 88 Group A: Group B: 93 96 77 80 83 89 an in up What do you conclude? 6. a wooded area, and a team of observers is sent out to find them. The team reports the distance at which they first sight each tent (true sightings only) until all 20 tents are found. The purpose of the study is to determine whether the patterned camouflage is more difficult to detect than the plain camouflage. The distances at which each tent is detected are Ten tents using plain camouflage and 10 tents using patterned camouflage are set as follows. reported Distance (meters) 25, 28, 16, 34, 38, 21, 29, 43, 32, 36 26, 12, 16, 21, 20, 14, 10, 18, 22, 20 Type of camouflage Plain Patterned (a) Perform a hypothesis test. (b) Find a nonparametric 95% confidence interval for the difference in mean detection distances. eT PROBLEMS 1. Let Note that there are mn pairs in all. Show that S and T satisfy the relationship equal the number of pairs (X, Y) in which Xi exceeds Y (counting ties as one-half). S =T-n(n + 1) 2 n(n+ 1) What statistic seems reasonable to use as an estimate of P(X> Y)?

Glencoe Algebra 1, Student Edition, 9780079039897, 0079039898, 2018
18th Edition
ISBN:9780079039897
Author:Carter
Publisher:Carter
Chapter10: Statistics
Section10.5: Comparing Sets Of Data
Problem 14PPS

Related questions

Concept explainers
Contingency Table
A contingency table can be defined as the visual representation of the relationship between two or more categorical variables that can be evaluated and registered. It is a categorical version of the scatterplot, which is used to investigate the linear relationship between two variables. A contingency table is indeed a type of frequency distribution table that displays two variables at the same time.
Binomial Distribution
Binomial is an algebraic expression of the sum or the difference of two terms. Before knowing about binomial distribution, we must know about the binomial theorem.
Topic Video
Question
Question 6 in image
Transcribed Image Text:287
PROBLEMS
5.1
algebra according to a new method. Find a 90% confidence interval for the difference in
achievement scores expected from the two methods.
Students' Achievement Scores
80 78
১), and
Method
ledger,
84
69
79
72
68
Present
70
72
73
68
(1975).
60
64
New
girls, with the following observed weight losses. Find a 90% confidence interval for mean
difference in effectiveness of the two diets.
Diet A was given to four overweight girls and diet B was given to five other overweight
96ाळ),
1953).
Kean
4.
AREYER
Weight Losses (pounds)
7, 2, -1, 4
6, 5, 2, 8, 3
Diet
dges
A
itzer
В
telescopic sight improves the ability to hit a target under twilight conditions. Group A is
group
972),
5. Eight volunteers for an experiment are divided randomly into two groups, to see if a
given
sights. After a learning period they are given a shooting test at twilight. These are their
B has the same kind of rifle but with open
rifles with telescopic sights, while
scores (100 is perfect).
85
88
Group A:
Group B:
93
96
77
80
83
89
an
in
up
What do you conclude?
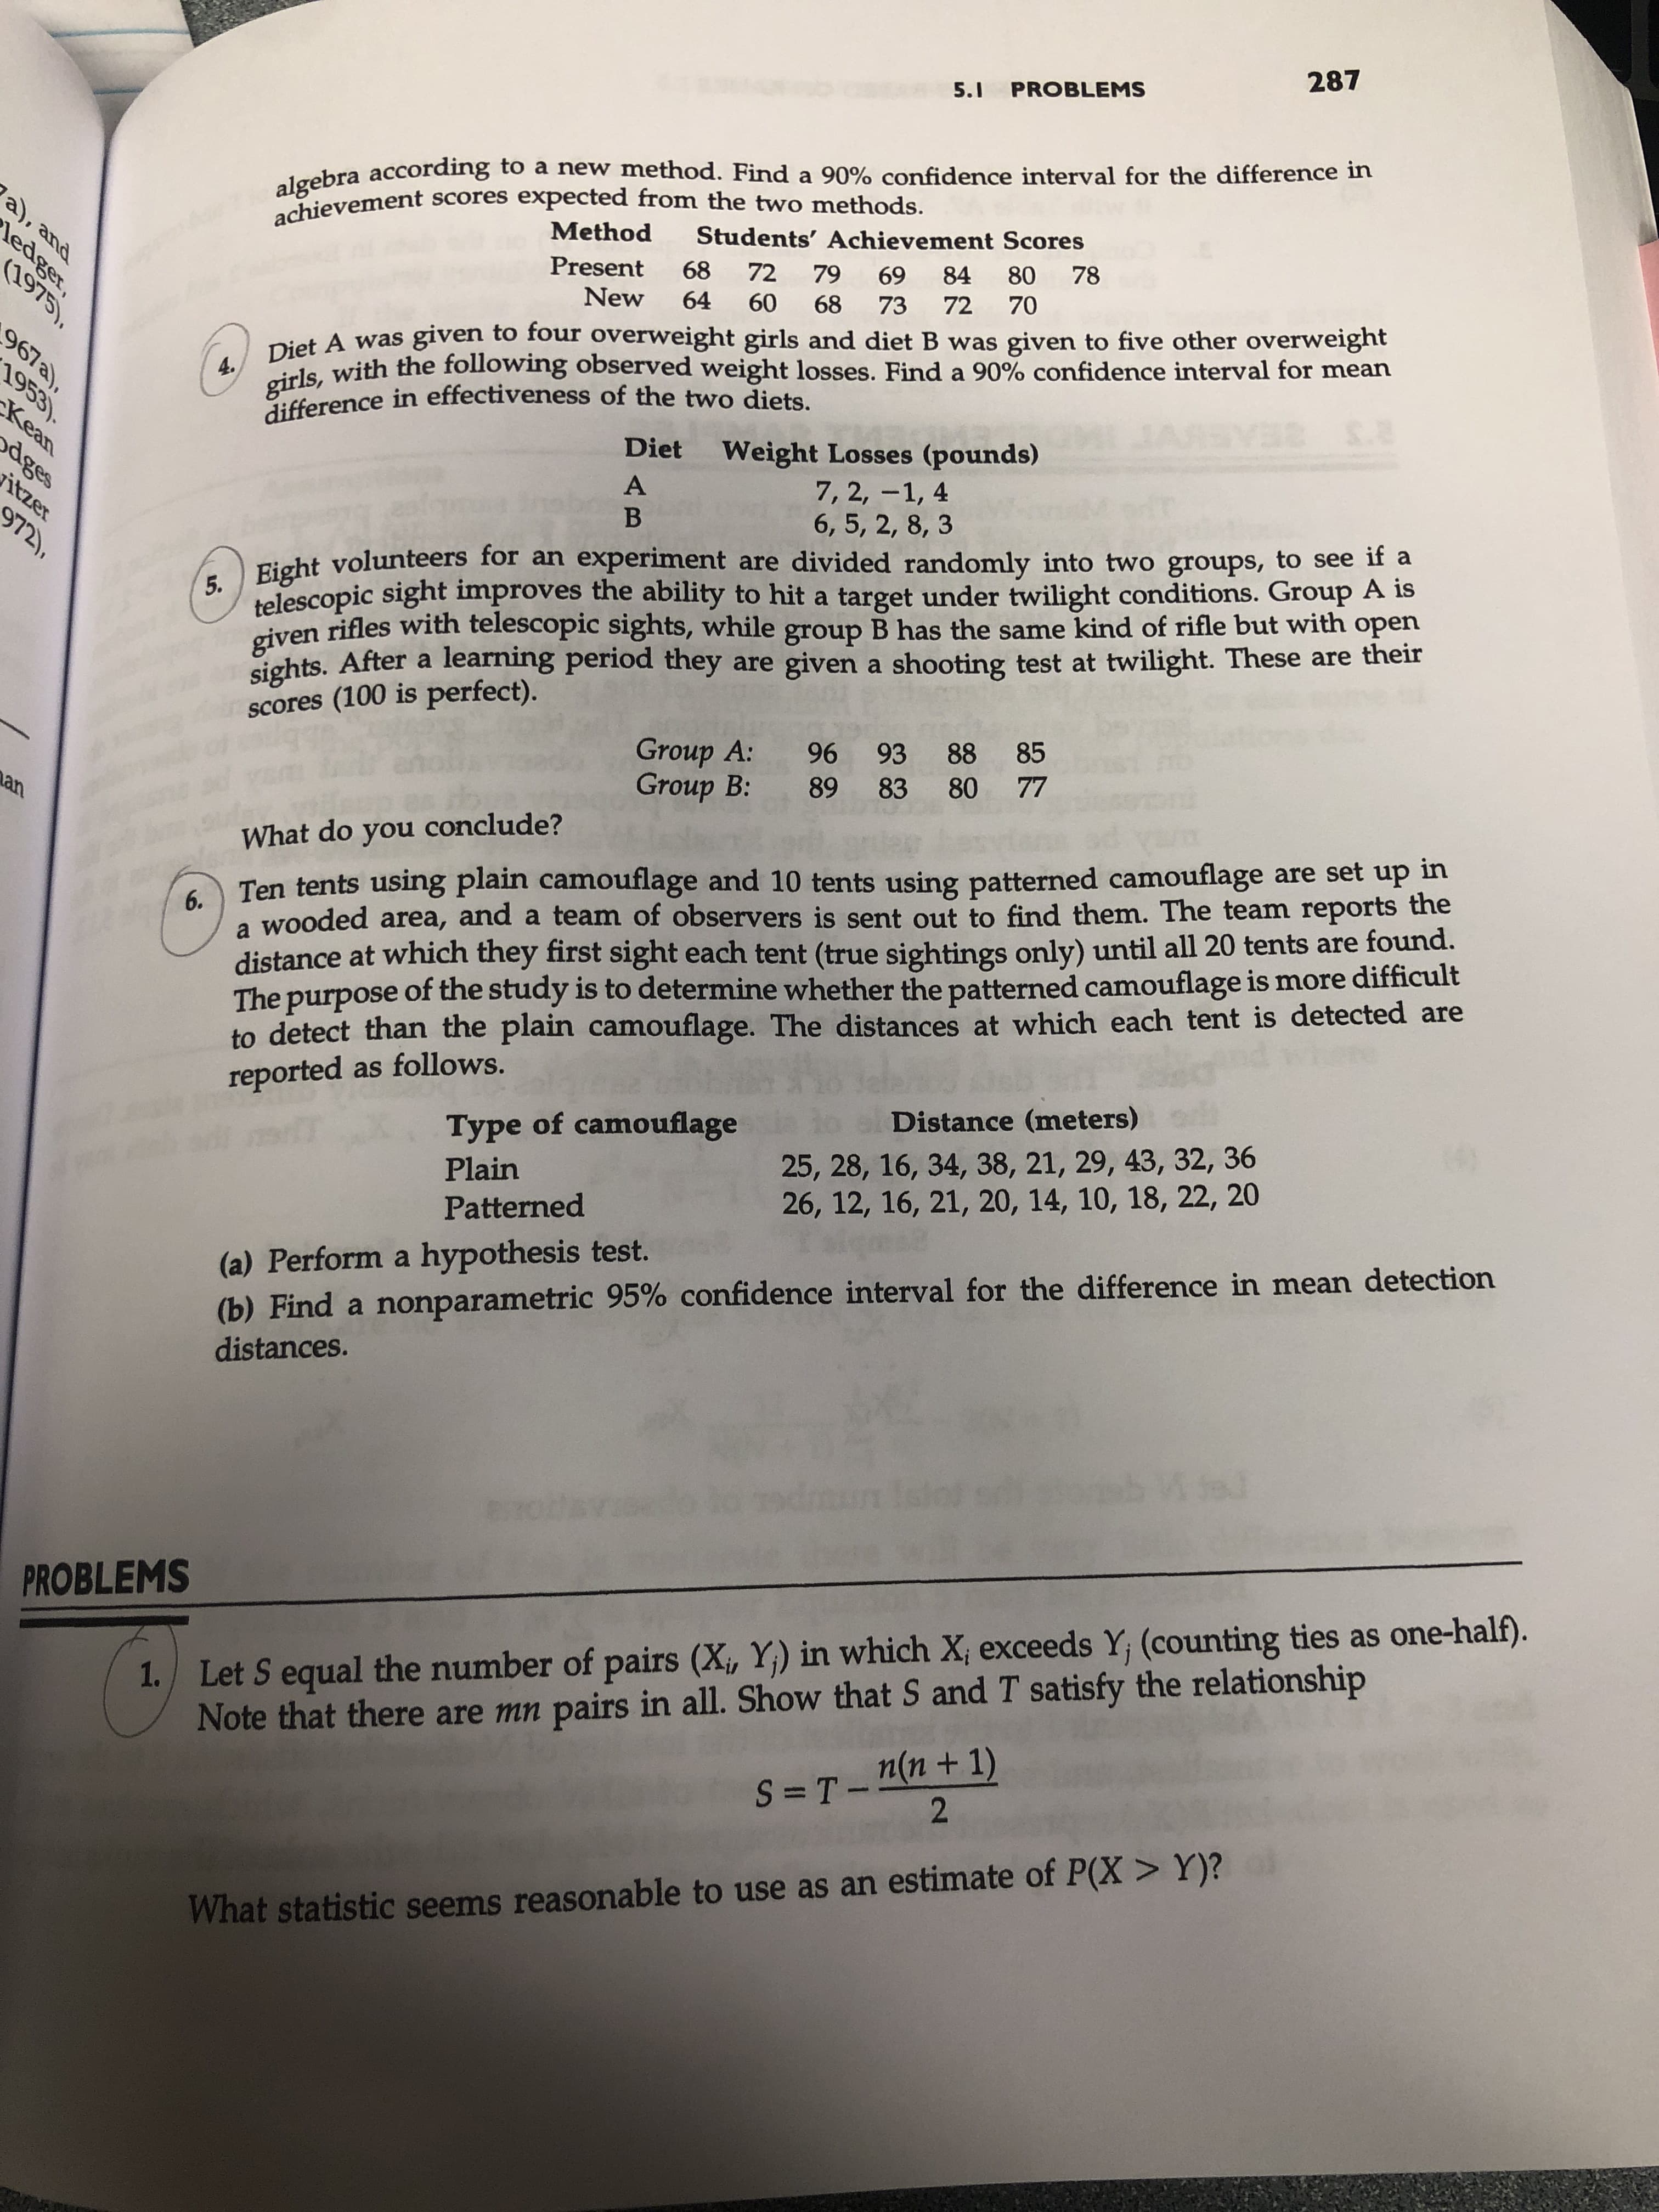
6.
a wooded area, and a team of observers is sent out to find them. The team reports the
distance at which they first sight each tent (true sightings only) until all 20 tents are found.
The purpose of the study is to determine whether the patterned camouflage is more difficult
to detect than the plain camouflage. The distances at which each tent is detected are
Ten tents using plain camouflage and 10 tents using patterned camouflage are set
as follows.
reported
Distance (meters)
25, 28, 16, 34, 38, 21, 29, 43, 32, 36
26, 12, 16, 21, 20, 14, 10, 18, 22, 20
Type of camouflage
Plain
Patterned
(a) Perform a hypothesis test.
(b) Find a nonparametric 95% confidence interval for the difference in mean detection
distances.
eT
PROBLEMS
1. Let
Note that there are mn pairs in all. Show that S and T satisfy the relationship
equal the number of pairs (X, Y) in which Xi exceeds Y (counting ties as one-half).
S =T-n(n + 1)
2
n(n+ 1)
What statistic seems reasonable to use as an estimate of P(X> Y)?
Expert Solution
This question has been solved!
Explore an expertly crafted, step-by-step solution for a thorough understanding of key concepts.

This is a popular solution!

Trending now
This is a popular solution!

Step by step
Solved in 2 steps with 1 images

Knowledge Booster


Learn more about
Need a deep-dive on the concept behind this application? Look no further. Learn more about this topic, statistics and related others by exploring similar questions and additional content below.Recommended textbooks for you
Glencoe Algebra 1, Student Edition, 9780079039897…
Algebra
ISBN:
9780079039897
Author:
Carter
Publisher:
McGraw Hill
Glencoe Algebra 1, Student Edition, 9780079039897…
Algebra
ISBN:
9780079039897
Author:
Carter
Publisher:
McGraw Hill