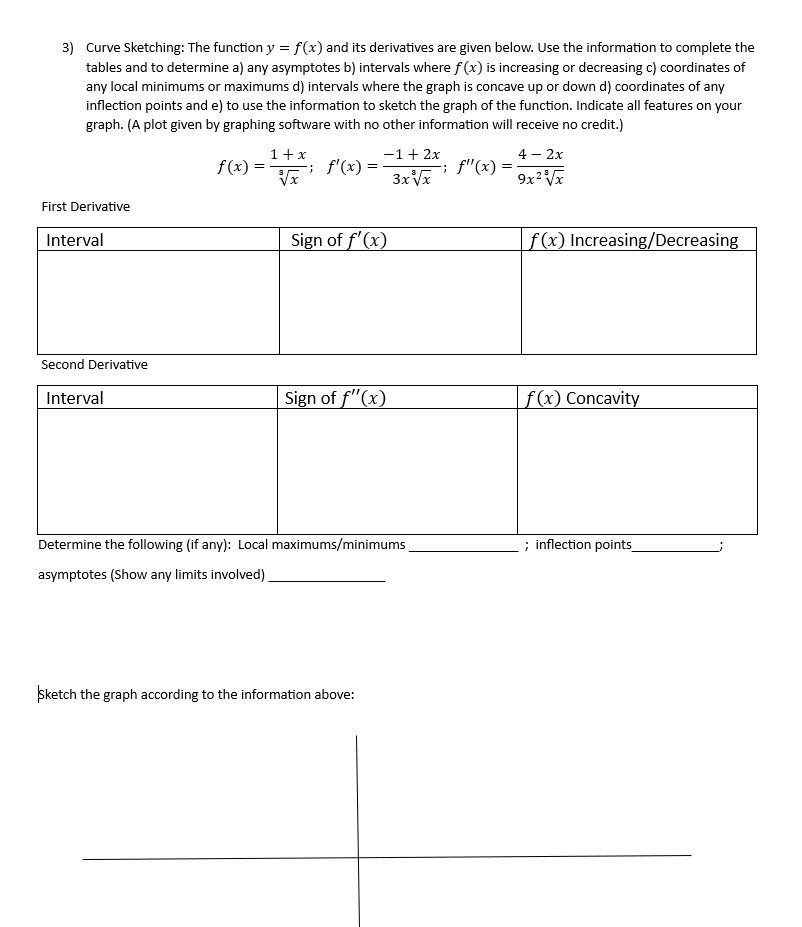
3) Curve Sketching: The function y = f(x) and its derivatives are given below. Use the information to complete the tables and to determine a) any asymptotes b) intervals where f(x) is increasing or decreasing c) coordinates of any local minimums or maximums d) intervals where the graph is concave up or down d) coordinates of any inflection points and e) to use the information to sketch the graph of the function. Indicate all features on your graph. (A plot given by graphing software with no other information will receive no credit.) First Derivative Interval Second Derivative Interval f(x)= = 1+x V√√x -; f'(x) = = -1 + 2x = -; f"(x) = 3x√x Sign of f'(x) Sign of f'(x) sketch the graph according to the information above: Determine the following (if any): Local maximums/minimums asymptotes (Show any limits involved) 4 - 2x 9x²√x f(x) Increasing/Decreasing f(x) Concavity ; inflection points
3) Curve Sketching: The function y = f(x) and its derivatives are given below. Use the information to complete the tables and to determine a) any asymptotes b) intervals where f(x) is increasing or decreasing c) coordinates of any local minimums or maximums d) intervals where the graph is concave up or down d) coordinates of any inflection points and e) to use the information to sketch the graph of the function. Indicate all features on your graph. (A plot given by graphing software with no other information will receive no credit.) First Derivative Interval Second Derivative Interval f(x)= = 1+x V√√x -; f'(x) = = -1 + 2x = -; f"(x) = 3x√x Sign of f'(x) Sign of f'(x) sketch the graph according to the information above: Determine the following (if any): Local maximums/minimums asymptotes (Show any limits involved) 4 - 2x 9x²√x f(x) Increasing/Decreasing f(x) Concavity ; inflection points

Trigonometry (MindTap Course List)
8th Edition
ISBN:9781305652224
Author:Charles P. McKeague, Mark D. Turner
Publisher:Charles P. McKeague, Mark D. Turner
Chapter4: Graphing And Inverse Functions
Section4.1: Basic Graphs
Problem 49PS

Related questions
Question
100%
Transcribed Image Text:3) Curve Sketching: The function y = f(x) and its derivatives are given below. Use the information to complete the
tables and to determine a) any asymptotes b) intervals where f(x) is increasing or decreasing c) coordinates of
any local minimums or maximums d) intervals where the graph is concave up or down d) coordinates of any
inflection points and e) to use the information to sketch the graph of the function. Indicate all features on your
graph. (A plot given by graphing software with no other information will receive no credit.)
First Derivative
Interval
Second Derivative
Interval
f(x)=
=
1+x
V√√x
-; f'(x) =
=
-1 + 2x
=
-; f"(x) =
3x√x
Sign of f'(x)
Sign of f'(x)
sketch the graph according to the information above:
Determine the following (if any): Local maximums/minimums
asymptotes (Show any limits involved)
4 - 2x
9x²√x
f(x) Increasing/Decreasing
f(x) Concavity
; inflection points
Expert Solution
This question has been solved!
Explore an expertly crafted, step-by-step solution for a thorough understanding of key concepts.

This is a popular solution!

Trending now
This is a popular solution!

Step by step
Solved in 6 steps with 5 images

Recommended textbooks for you
Trigonometry (MindTap Course List)
Trigonometry
ISBN:
9781305652224
Author:
Charles P. McKeague, Mark D. Turner
Publisher:
Cengage Learning

Algebra and Trigonometry (MindTap Course List)
Algebra
ISBN:
9781305071742
Author:
James Stewart, Lothar Redlin, Saleem Watson
Publisher:
Cengage Learning

Algebra & Trigonometry with Analytic Geometry
Algebra
ISBN:
9781133382119
Author:
Swokowski
Publisher:
Cengage
Trigonometry (MindTap Course List)
Trigonometry
ISBN:
9781305652224
Author:
Charles P. McKeague, Mark D. Turner
Publisher:
Cengage Learning
Algebra and Trigonometry (MindTap Course List)
Algebra
ISBN:
9781305071742
Author:
James Stewart, Lothar Redlin, Saleem Watson
Publisher:
Cengage Learning
Algebra & Trigonometry with Analytic Geometry
Algebra
ISBN:
9781133382119
Author:
Swokowski
Publisher:
Cengage