3) Veterinary Science: Shetland Ponies - How much should pony (in months), and let y be the average weight of the pony (in kilograms). The following information is based on data taken from The Merck Veterinary Manual (a reference used in most veterinary colleges). 3. 60 12 rolod 18 femo24 60 95 140 170 185 a) Make a scatter diagram and draw a line you think best fits the data. (10. bst aboM
3) Veterinary Science: Shetland Ponies - How much should pony (in months), and let y be the average weight of the pony (in kilograms). The following information is based on data taken from The Merck Veterinary Manual (a reference used in most veterinary colleges). 3. 60 12 rolod 18 femo24 60 95 140 170 185 a) Make a scatter diagram and draw a line you think best fits the data. (10. bst aboM

MATLAB: An Introduction with Applications
6th Edition
ISBN:9781119256830
Author:Amos Gilat
Publisher:Amos Gilat
Chapter1: Starting With Matlab
Section: Chapter Questions
Problem 1P

Related questions
Question
100%
Can you please check over my math I feel like it's wrong. It'd for d
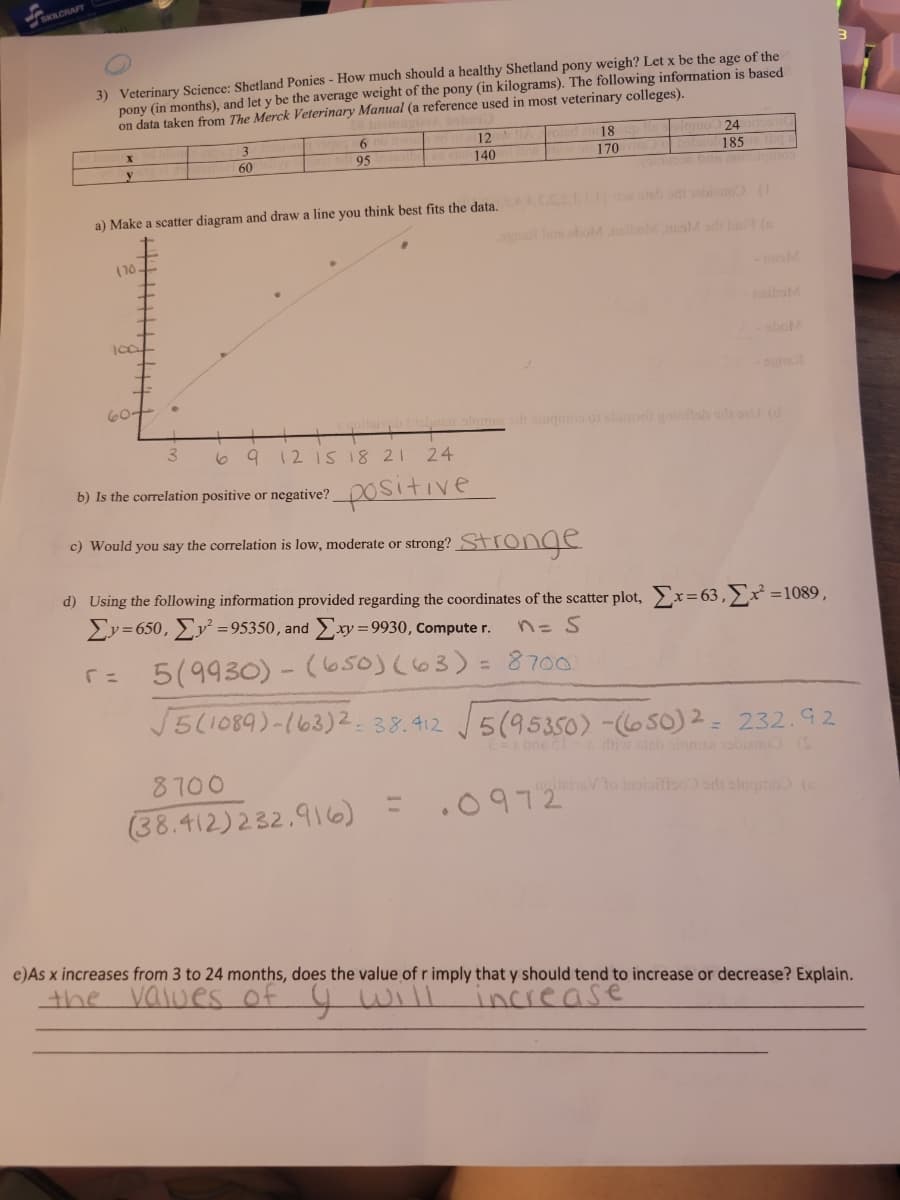
Transcribed Image Text:3) Veterinary Science: Shetland Ponies - How much should a healthy Shetland pony weigh? Let x be the age of the
pony (in months), and let y be the average weight of the pony (in kilograms). The following information is based
on data taken from The Merck Veterinary Manual (a reference used in most veterinary colleges).
olomo 24
185
12
18
3.
60
95
140
170
no (1
a) Make a scatter diagram and draw a line you think best fits the data, C0LLI
s oboM boMalM s b (s
(10.
niboM
oboM
60+
olom sib ougoo o1 slum gintsb l (d
9 12 IS I8 21
24
b) Is the correlation positive or negative?DOSitive
c) Would you say the correlation is low, moderate or strong? Stronge
d) Using the following information provided regarding the coordinates of the scatter plot, Ex=63,>x =1089,
y3650, y =95350, and xy=9930, Compute r.
n= 5
5(9930) - (650)(63)= 8700
「ニ
5(1089)-163)2.38.412 J5(95350) -(650) 2= 232.92
bne d eb sloms obieno (S
8700
(38.412)232.916)
noheraV to tnsioiftoo) sdi stugmo (
.0972
e)As x increases from 3 to 24 months, does the value of r imply that y should tend to increase or decrease? Explain.
the
values of
ywill
increase
Expert Solution
This question has been solved!
Explore an expertly crafted, step-by-step solution for a thorough understanding of key concepts.

Step by step
Solved in 2 steps with 2 images

Knowledge Booster


Learn more about
Need a deep-dive on the concept behind this application? Look no further. Learn more about this topic, statistics and related others by exploring similar questions and additional content below.Recommended textbooks for you
MATLAB: An Introduction with Applications
Statistics
ISBN:
9781119256830
Author:
Amos Gilat
Publisher:
John Wiley & Sons Inc

Probability and Statistics for Engineering and th…
Statistics
ISBN:
9781305251809
Author:
Jay L. Devore
Publisher:
Cengage Learning

Statistics for The Behavioral Sciences (MindTap C…
Statistics
ISBN:
9781305504912
Author:
Frederick J Gravetter, Larry B. Wallnau
Publisher:
Cengage Learning
MATLAB: An Introduction with Applications
Statistics
ISBN:
9781119256830
Author:
Amos Gilat
Publisher:
John Wiley & Sons Inc
Probability and Statistics for Engineering and th…
Statistics
ISBN:
9781305251809
Author:
Jay L. Devore
Publisher:
Cengage Learning
Statistics for The Behavioral Sciences (MindTap C…
Statistics
ISBN:
9781305504912
Author:
Frederick J Gravetter, Larry B. Wallnau
Publisher:
Cengage Learning

Elementary Statistics: Picturing the World (7th E…
Statistics
ISBN:
9780134683416
Author:
Ron Larson, Betsy Farber
Publisher:
PEARSON

The Basic Practice of Statistics
Statistics
ISBN:
9781319042578
Author:
David S. Moore, William I. Notz, Michael A. Fligner
Publisher:
W. H. Freeman

Introduction to the Practice of Statistics
Statistics
ISBN:
9781319013387
Author:
David S. Moore, George P. McCabe, Bruce A. Craig
Publisher:
W. H. Freeman