3. 2.58 In 2007, unemployment rates in the 50 U.S. states were reported as follows. These data are also provided in the file XR02058. (SOURCE: Bureau of the Census, Statistical Abstract of the united States 2009, p. 373.) Percent Percent Percent 5. 4.0 6.2 3.9 OH OK 5.6 6. O 4.7 8. O 9. O 10. O 5.3 3.7 4.9 5.6 CO CT DE 4.6 SC SD 3.5 5.0 3.6 4.6 4.3 2.9 3.0 5.1 4.6 3.7 4.6 3.6 4.0 12. O 13. O 14. O 15. O ID VA WA NJ 3.7 4.6 4.5 4.6 5.0 2.9 IA WY KY Complete a stem-and-leaf display for these data. Round your answers to one decimal place, if necessary Stem-and-leaf of Unemp% N 50 Leaf Unit1 Questions Questiun 2 of 15 5.0 5.2 5.3 5.4 5.6 6.1 6.2 4.0 Cont Check My Work 4.1 2.58 In 2007, unemployment rates in These data are also provided Statistical Abstract of the United States 2009, p. 50 U.S. states were reported as follows in the file XRO2058. (SOURCE: Bureau of the Census 3.9 3.1 Percent Percent Percent LA ME OR (2 34666 MA 1 0 MT UT 72 5.0
3. 2.58 In 2007, unemployment rates in the 50 U.S. states were reported as follows. These data are also provided in the file XR02058. (SOURCE: Bureau of the Census, Statistical Abstract of the united States 2009, p. 373.) Percent Percent Percent 5. 4.0 6.2 3.9 OH OK 5.6 6. O 4.7 8. O 9. O 10. O 5.3 3.7 4.9 5.6 CO CT DE 4.6 SC SD 3.5 5.0 3.6 4.6 4.3 2.9 3.0 5.1 4.6 3.7 4.6 3.6 4.0 12. O 13. O 14. O 15. O ID VA WA NJ 3.7 4.6 4.5 4.6 5.0 2.9 IA WY KY Complete a stem-and-leaf display for these data. Round your answers to one decimal place, if necessary Stem-and-leaf of Unemp% N 50 Leaf Unit1 Questions Questiun 2 of 15 5.0 5.2 5.3 5.4 5.6 6.1 6.2 4.0 Cont Check My Work 4.1 2.58 In 2007, unemployment rates in These data are also provided Statistical Abstract of the United States 2009, p. 50 U.S. states were reported as follows in the file XRO2058. (SOURCE: Bureau of the Census 3.9 3.1 Percent Percent Percent LA ME OR (2 34666 MA 1 0 MT UT 72 5.0

Algebra & Trigonometry with Analytic Geometry
13th Edition
ISBN:9781133382119
Author:Swokowski
Publisher:Swokowski
Chapter5: Inverse, Exponential, And Logarithmic Functions
Section5.6: Exponential And Logarithmic Equations
Problem 69E

Related questions
Question
I don't understand what I'm doing wrong. This is my first statistics class and I understand the basics of stem and leaf displays. There are 50 states in the problem but not 50 boxes. I did the stem and leaf chart, but now how do I get that into the bottom boxes? It makes no sense to me at all.
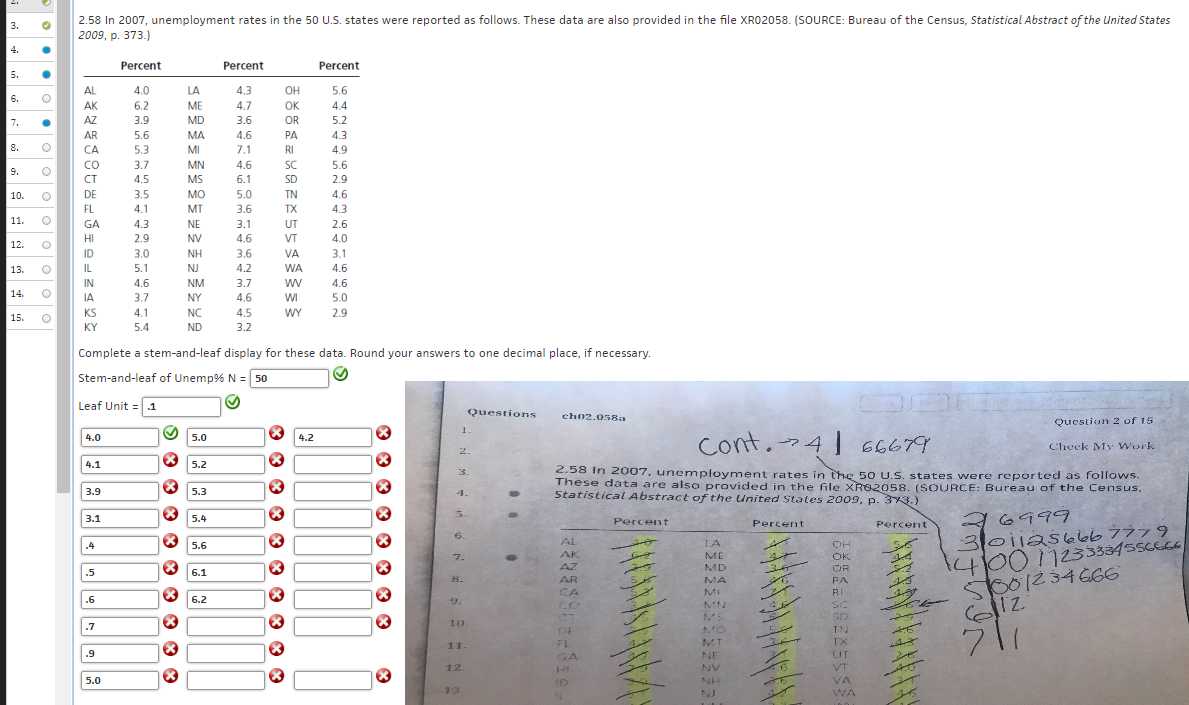
Transcribed Image Text:3. 2.58 In 2007, unemployment rates in the 50 U.S. states were reported as follows. These data are also provided in the file XR02058. (SOURCE: Bureau of the Census, Statistical Abstract of the united States
2009, p. 373.)
Percent
Percent
Percent
5.
4.0
6.2
3.9
OH
OK
5.6
6. O
4.7
8. O
9. O
10. O
5.3
3.7
4.9
5.6
CO
CT
DE
4.6
SC
SD
3.5
5.0
3.6
4.6
4.3
2.9
3.0
5.1
4.6
3.7
4.6
3.6
4.0
12. O
13. O
14. O
15. O
ID
VA
WA
NJ
3.7
4.6
4.5
4.6
5.0
2.9
IA
WY
KY
Complete a stem-and-leaf display for these data. Round your answers to one decimal place, if necessary
Stem-and-leaf of Unemp% N 50
Leaf Unit1
Questions
Questiun 2 of 15
5.0
5.2
5.3
5.4
5.6
6.1
6.2
4.0
Cont
Check My Work
4.1
2.58 In 2007, unemployment rates in
These data are also provided
Statistical Abstract of the United States 2009, p.
50 U.S. states were reported as follows
in the file XRO2058. (SOURCE: Bureau of the Census
3.9
3.1
Percent
Percent
Percent
LA
ME
OR
(2 34666
MA
1 0
MT
UT
72
5.0
Expert Solution
This question has been solved!
Explore an expertly crafted, step-by-step solution for a thorough understanding of key concepts.

This is a popular solution!
Step 1
VIEW
Trending now
This is a popular solution!

Step by step
Solved in 1 steps with 1 images

Knowledge Booster


Learn more about
Need a deep-dive on the concept behind this application? Look no further. Learn more about this topic, statistics and related others by exploring similar questions and additional content below.Recommended textbooks for you
Algebra & Trigonometry with Analytic Geometry
Algebra
ISBN:
9781133382119
Author:
Swokowski
Publisher:
Cengage

Glencoe Algebra 1, Student Edition, 9780079039897…
Algebra
ISBN:
9780079039897
Author:
Carter
Publisher:
McGraw Hill
Algebra & Trigonometry with Analytic Geometry
Algebra
ISBN:
9781133382119
Author:
Swokowski
Publisher:
Cengage
Glencoe Algebra 1, Student Edition, 9780079039897…
Algebra
ISBN:
9780079039897
Author:
Carter
Publisher:
McGraw Hill