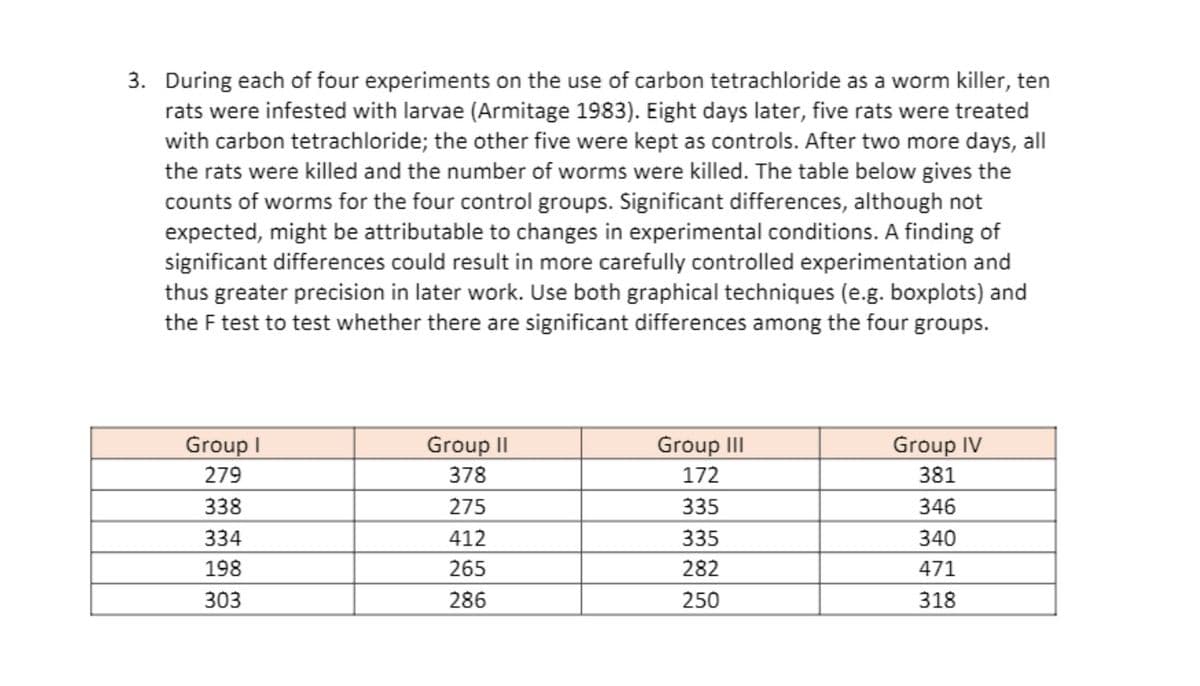
3. During each of four experiments on the use of carbon tetrachloride as a worm killer, ten rats were infested with larvae (Armitage 1983). Eight days later, five rats were treated with carbon tetrachloride; the other five were kept as controls. After two more days, all the rats were killed and the number of worms were killed. The table below gives the counts of worms for the four control groups. Significant differences, although not expected, might be attributable to changes in experimental conditions. A finding of significant differences could result in more carefully controlled experimentation and thus greater precision in later work. Use both graphical techniques (e.g. boxplots) and the F test to test whether there are significant differences among the four groups. Group I Group II Group II Group IV 279 378 172 381 338 275 335 346 334 412 335 340 198 265 282 471 303 286 250 318
3. During each of four experiments on the use of carbon tetrachloride as a worm killer, ten rats were infested with larvae (Armitage 1983). Eight days later, five rats were treated with carbon tetrachloride; the other five were kept as controls. After two more days, all the rats were killed and the number of worms were killed. The table below gives the counts of worms for the four control groups. Significant differences, although not expected, might be attributable to changes in experimental conditions. A finding of significant differences could result in more carefully controlled experimentation and thus greater precision in later work. Use both graphical techniques (e.g. boxplots) and the F test to test whether there are significant differences among the four groups. Group I Group II Group II Group IV 279 378 172 381 338 275 335 346 334 412 335 340 198 265 282 471 303 286 250 318

Glencoe Algebra 1, Student Edition, 9780079039897, 0079039898, 2018
18th Edition
ISBN:9780079039897
Author:Carter
Publisher:Carter
Chapter10: Statistics
Section10.6: Summarizing Categorical Data
Problem 27PPS

Related questions
Question
Transcribed Image Text:3. During each of four experiments on the use of carbon tetrachloride as a worm killer, ten
rats were infested with larvae (Armitage 1983). Eight days later, five rats were treated
with carbon tetrachloride; the other five were kept as controls. After two more days, all
the rats were killed and the number of worms were killed. The table below gives the
counts of worms for the four control groups. Significant differences, although not
expected, might be attributable to changes in experimental conditions. A finding of
significant differences could result in more carefully controlled experimentation and
thus greater precision in later work. Use both graphical techniques (e.g. boxplots) and
the F test to test whether there are significant differences among the four groups.
Group I
Group II
Group II
Group IV
279
378
172
381
338
275
335
346
334
412
335
340
198
265
282
471
303
286
250
318
Expert Solution
This question has been solved!
Explore an expertly crafted, step-by-step solution for a thorough understanding of key concepts.

This is a popular solution!

Trending now
This is a popular solution!

Step by step
Solved in 2 steps with 1 images

Knowledge Booster


Learn more about
Need a deep-dive on the concept behind this application? Look no further. Learn more about this topic, statistics and related others by exploring similar questions and additional content below.Recommended textbooks for you
Glencoe Algebra 1, Student Edition, 9780079039897…
Algebra
ISBN:
9780079039897
Author:
Carter
Publisher:
McGraw Hill

Linear Algebra: A Modern Introduction
Algebra
ISBN:
9781285463247
Author:
David Poole
Publisher:
Cengage Learning
Glencoe Algebra 1, Student Edition, 9780079039897…
Algebra
ISBN:
9780079039897
Author:
Carter
Publisher:
McGraw Hill
Linear Algebra: A Modern Introduction
Algebra
ISBN:
9781285463247
Author:
David Poole
Publisher:
Cengage Learning