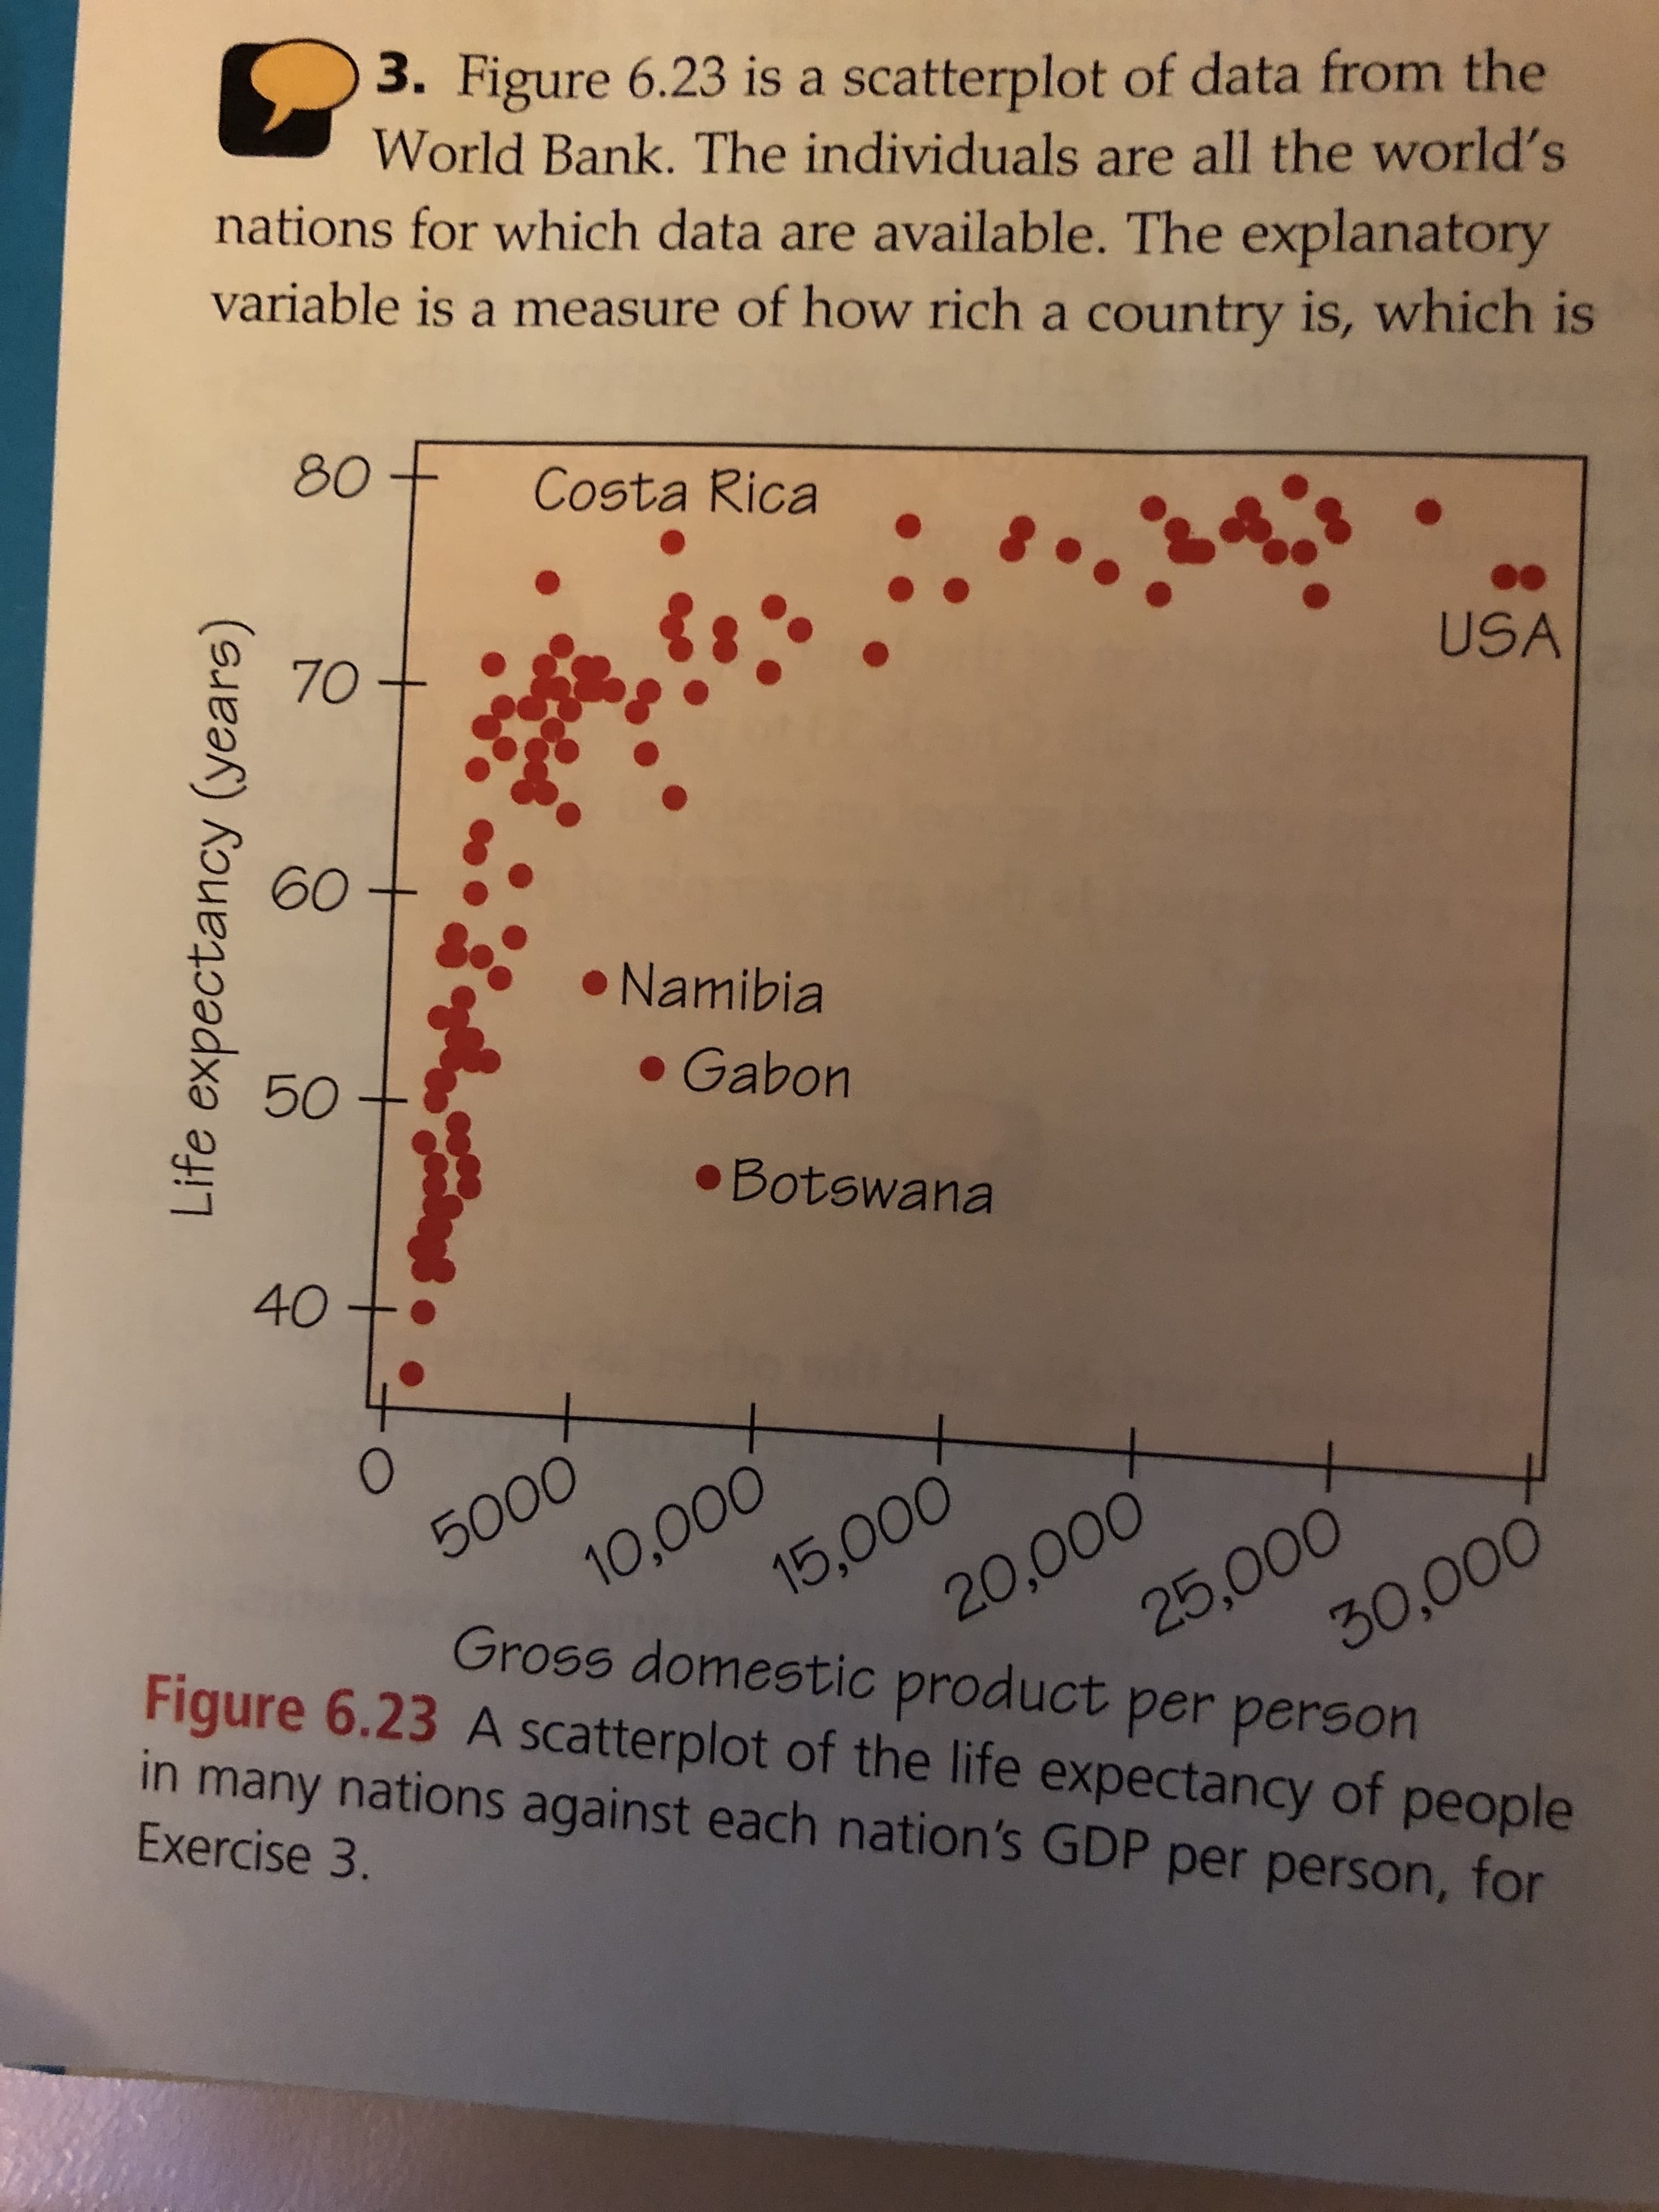
3. Figure 6.23 is a scatterplot of data from the World Bank. The individuals are all the world's nations for which data are available. The explanatory variable is a measure of how rich a country is, which is 80 Costa Rica 70 USA 60 Namibia 50 Gabon Botswana 40 5000 10,000 20,000 Gross domestic product per person Figure 6.23 A scatterplot of the life expectancy of people 25,000 30,000 15,000 in many nations against each nation's GDP per person, for Exercise 3. Life expectancy (years) ng Data: Relationships the gross domestic product (GDP) per person. GDP is the total value of the goods and services produced in a country, converted into dollars. The response variable is life expectancy at birth. Three African nations are outliers, with lower life expectancy than usual for their GDP. A full study would ask what special circumstances explain the ot these outliers. (a) Describe the direction and form of the relationship. Aside from the outliers, it is moderately strong. gth) (b) Explain why the direction and form of this al? relationship make sense.
3. Figure 6.23 is a scatterplot of data from the World Bank. The individuals are all the world's nations for which data are available. The explanatory variable is a measure of how rich a country is, which is 80 Costa Rica 70 USA 60 Namibia 50 Gabon Botswana 40 5000 10,000 20,000 Gross domestic product per person Figure 6.23 A scatterplot of the life expectancy of people 25,000 30,000 15,000 in many nations against each nation's GDP per person, for Exercise 3. Life expectancy (years) ng Data: Relationships the gross domestic product (GDP) per person. GDP is the total value of the goods and services produced in a country, converted into dollars. The response variable is life expectancy at birth. Three African nations are outliers, with lower life expectancy than usual for their GDP. A full study would ask what special circumstances explain the ot these outliers. (a) Describe the direction and form of the relationship. Aside from the outliers, it is moderately strong. gth) (b) Explain why the direction and form of this al? relationship make sense.

Principles of Economics 2e
2nd Edition
ISBN:9781947172364
Author:Steven A. Greenlaw; David Shapiro
Publisher:Steven A. Greenlaw; David Shapiro
Chapter19: The Macroeconomic Perspective
Section: Chapter Questions
Problem 28P: Last year, a small nation with abundant forests cut down 200 worth of trees. It then turned 100...

Related questions
Question
(A) Describe the direction and the form of the relationship aside from the outliers it is moderatley strong.
(B) Explain why the direction and form of this relationship make sense.
Transcribed Image Text:3. Figure 6.23 is a scatterplot of data from the
World Bank. The individuals are all the world's
nations for which data are available. The explanatory
variable is a measure of how rich a country is, which is
80
Costa Rica
70
USA
60
Namibia
50
Gabon
Botswana
40
5000
10,000
20,000
Gross domestic product per person
Figure 6.23 A scatterplot of the life expectancy of people
25,000
30,000
15,000
in many nations against each nation's GDP per person, for
Exercise 3.
Life expectancy (years)
Transcribed Image Text:ng Data: Relationships
the gross domestic product (GDP) per person. GDP is
the total value of the goods and services produced in a
country, converted into dollars. The response variable is
life expectancy at birth. Three African nations are outliers,
with lower life expectancy than usual for their GDP. A
full study would ask what special circumstances explain
the
ot
these outliers.
(a) Describe the direction and form of the relationship.
Aside from the outliers, it is moderately strong.
gth)
(b) Explain why the direction and form of this
al?
relationship make sense.
Expert Solution
This question has been solved!
Explore an expertly crafted, step-by-step solution for a thorough understanding of key concepts.

This is a popular solution!

Trending now
This is a popular solution!

Step by step
Solved in 2 steps

Knowledge Booster


Learn more about
Need a deep-dive on the concept behind this application? Look no further. Learn more about this topic, economics and related others by exploring similar questions and additional content below.Recommended textbooks for you
Principles of Economics 2e
Economics
ISBN:
9781947172364
Author:
Steven A. Greenlaw; David Shapiro
Publisher:
OpenStax

Brief Principles of Macroeconomics (MindTap Cours…
Economics
ISBN:
9781337091985
Author:
N. Gregory Mankiw
Publisher:
Cengage Learning

Essentials of Economics (MindTap Course List)
Economics
ISBN:
9781337091992
Author:
N. Gregory Mankiw
Publisher:
Cengage Learning
Principles of Economics 2e
Economics
ISBN:
9781947172364
Author:
Steven A. Greenlaw; David Shapiro
Publisher:
OpenStax
Brief Principles of Macroeconomics (MindTap Cours…
Economics
ISBN:
9781337091985
Author:
N. Gregory Mankiw
Publisher:
Cengage Learning
Essentials of Economics (MindTap Course List)
Economics
ISBN:
9781337091992
Author:
N. Gregory Mankiw
Publisher:
Cengage Learning

