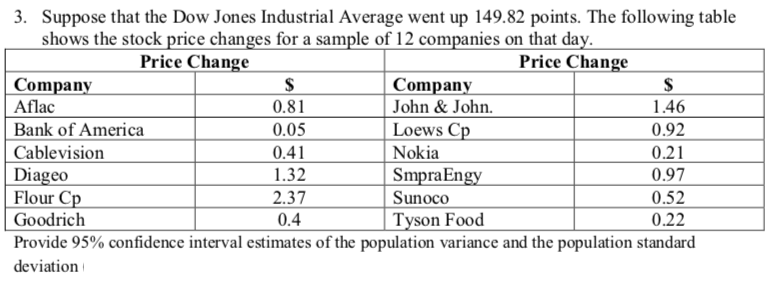
3. Suppose that the Dow Jones Industrial Average went up 149.82 points. The following table shows the stock price changes for a sample of 12 companies on that day. Price Change Price Change Company Company John & John. Aflac Bank of America 0.81 0.05 1.46 0.92 Loews Cp Nokia 0.21 0.97 Cablevision 0.41 Diageo Flour Cp 1.32 2.37 SmpraEngy Sunoco | Tyson Food 0.52 Goodrich 0.4 0.22 Provide 95% confidence interval estimates of the population variance and the population standard deviation


Q: The director of library services at a college did a survey of types of books (by subject) in the…
A: a)The level of significance is 5%.The null and alternative hypotheses are stated below:H0: The…
Q: The Australian Security Exchange (ASX) has more than 2000 listed companies as of 2020. The following…
A: Mean annual returns of the given top ten companies are calculated as So the mean return is 12.09%.
Q: Calculate the mean annual return of the above ten companies. b) List out the companies that are…
A: Given data Company Average Annual Return (%) Archer Daniels Midland 10.5 American…
Q: 1. A veterinarian keeps track of the types of animals treated by an animal clinic. The following…
A: In this case, we know the animal clinic treats 230 animals in a month. Therefore, If Dog = 230, the…
Q: The following table shows a data set containing information for 25 of the shadow stocks tracked by…
A:
Q: Below are the results of a cohort study. What is the attributable risk percent among the exposed…
A: The attributable risk percent among the exposed is given as: Risk percentage among exposed=Number of…
Q: study, Phoenix Marketing International identified Bridgeport, Connecticut; San Jose, California;…
A: Solution (a) Percentage of millionaires: A B C D TOTAL YES 45 35 35 32 147 NO 455 265 365…
Q: Here is a sample of prices of notepads at the KPU bookstore: (in dollars) 11 10 11 14 15 11 11 16 2…
A: Given sample values are 11, 10, 11, 14, 15, 11, 11, 16, 2, 13, 1, 16, 2, 4. The frequency…
Q: What is the beverage cost percentage for Bartenders 1 and 2, given the information in the following…
A: Given data of cost percentage of bartender 1 and bartender 2 as shown below the average beverage…
Q: 3.7 The article "Housework around the World" (USA Today, September 15, 2009) included the percentage…
A: (a) Enter the data into the excel sheet as follows: Select Insert> charts>All charts…
Q: 1. By predicting fertility and divorce rates as well as life-styles economic, demographers attempt…
A: The question is about to find missing relative frequency Given :
Q: 3. Solano College wanted to know if their student body was changing its educational make up. In…
A: The question is about categorical data analysis Given : To test : Is the educ. make - up of the…
Q: In 2010, MonsterCollege surveyed 1250 U.S.college students expecting to graduate in the next several…
A: According to the graph there are two points where salary was anticipated by more than 20% of…
Q: Read the following case study and answer ALL questions that follow. Royal bank is in the process of…
A: Solution : Given : Sample data of client savings 3.1 Variables in the study are - Gender, Marital…
Q: Sunshine Kleebler Nabisco Private Times Displayed = 424 350…
A: Given problem Given that Sunshine Kleebler Nabisco Private Times Displayed 424 350 1120…
Q: A survey of a group's web habits for the past month obtained the following information. 31% visited…
A: It is an important part of statistics. It is widely used.
Q: 1. The summary statistics for the number of inches of rainfall in Los Angeles for 117 years,…
A: Solution : Given : summary statistics for the no. of inches of rainfall in Los Angeles for 177…
Q: In January 2019, a small company headquartered in Baltimore needed to track its cost per employee in…
A: Hey, since there are multiple subparts posted, we will answer first three subparts. If you want any…
Q: Accountants use the term budget lapsing to describe the situation that occurs when unspent funds do…
A: a) The lower quartile is a value below which 25% of the observations lies and above which 75% of the…
Q: Identify the data collection method used in the following statements: 1. A researcher investigates…
A: Hi! Thank you for the question, As per the honour code, we are allowed to answer three sub-parts at…
Q: What was discharge rate for January 2, 2017? Admissions and discharges in hospital Jan. 1, 2017…
A:
Q: 3. The registrar wants to know if the average encoding period of time in the school automate is 30…
A: We have given that the two statements about to the null and alternative hypotheses.
Q: 5 An economist believes that the average annual income of men and women are the same in the United…
A: Given An economist believe that the average annual income of men and women is the same in the united…
Q: single persons receiving social security payments revealed these monthly benefits: $965, $826, $699,…
A: The modal value (Mode) is the value with the highest frequency, that is, the mode is the value in…
Q: is an outlier?
A: a) Outlier: The Observation which lies outside the control limit is called an outlier. an outlier is…
Q: June 17, 2020 to answer the questions below. County Total Cases New London 1,217 Fairfield…
A: Given data Coun try Total cases New London…
Q: 2) Suppose an economist wants to compare the mean dollar amounts owed by delinquent credit card…
A:
Q: Suppose a KungFu Tea store opens and sells 90.5 cups daily, on average, daily sale are independant.…
A: Solution : Given : Average sale = 90.5 cups Let , X : No. of cups sold in last December. and sales…
Q: 2. A Bloomberg Businessweek North American subscriber study collected data from a sample of 2861…
A: Note: Hi there! Thank you for posting the question. As there are multiple sub parts, according to…
Q: What was admission rate for January 3, 2017? Admissions and discharges in hospital Jan. 1, 2017…
A: Explanation: Total in Jan. 3, 2017 = Admissions in Jan. 3, 2017 + Discharge in Jan. 3, 2017…
Q: (a) Do you think that the percentage of all American movie-goers who think the popcorn is…
A: Given that 12% of a random sample of 25 American movie-goers thought the popcorn sold at the movie…
Q: A survey of a group's web habits for the past month obtained the following information. 38% visited…
A: Solution: Let A be the event that a person visited Facebook, B be the event that a person visited…
Q: Suppose we are now interested in taking random samples of 800 US adults instead of 150 and…
A: As we know that, Sample proportion is given by, p= X/n Where n is sample size.
Q: Compare the results of the Paasche versus the Laspeyres Index for the year 1984?
A: Year 1984 is given as a currant year where as the year 1983 as the base year. Laspeyres index: The…
Q: Suppose you took a survey designed to assess criminal justice students and their attitudes towards…
A: Variables are classified according to their purpose in a research.
Q: Transport trade association conducted a survey of their members to determine what they felt were the…
A: Introduction: Suppose X and Y are two events, with respective probabilities P (X) and P (Y). Denote…
Q: Suppose the following table gives the extra travel time each year, in hours, for peak-period…
A: We have given the details of the extra travel time each year, in hours, for peak-period travelers in…
Q: 3. A market researcher who wants to study the differences of the monthly gross sales of two 7-11…
A: 3. The research is about to study the difference of the monthly gross sales of two 7-11 branches in…
Q: The table below contains data on examination of customer orders. Every day 30 orders were examined.…
A: p chart is the chart for fraction rejected or non-conforming to specification. Given, Day number…
Q: According to Padgett Business Services, 20% of all small-business owners say the most important…
A: Solution: a. Let X be the number of owners would say preparing for long hours and hard work is the…
Q: The registrar’s office at ACC predicts that 90% of the 6,950 spaces open in various math classes…
A:
Q: 1. Dick Hoover, owner of Modern Office Equipment, is concerned about freight costs and clerical…
A: Since you have posted a question with multiple sub-parts, we will solve first three sub-parts for…
Q: (A) Socially conscious investors screen out stocks of alcohol and tobacco makers, firms with poor…
A: We have given that Sample size n =36 Sample mean =17.6 Sample standard deviation =5.6 Population…
Q: Pretend it is almost election time in 2040. You are on the reelection staff of President Adrian…
A:
Q: Which region would benefit from a campaign getting the word out about "Hot Dawg, its Hot Dogs!"?…
A: Segment Sample size Over all awareness number %over all awareness North City 300 31 10% South…
Q: Politifact reported that on September 29, 2015, Cecile Richards, then president of Planned…
A: Introduction: The given chart marks the years from 2006 to 2013 on the horizontal axis. The counts…
Q: The following list contains the average annual total returns (in percentage points) for 23 mutual…
A: Measures of central tendency help you find the middle, or the average, of a data set. The 3 most…
Q: A market researcher company requested all teachers of a particular school to fill up a questionnaire…
A: A qualitative variable is a variable which is categorical and does not take in numerical values A…


Trending now
This is a popular solution!

Step by step
Solved in 3 steps with 5 images

- Consider the table. Sales on Toaster Ovens 2004 2005 2006 2007 2008 Super Deluxe $86,100 $140,500 $65,800 $56,100 $59,000 Deluxe 103,200 136,100 129,900 133,800 75,400 Standard 147,300 123,600 125,500 132,600 58,000 What percent of the total sales in 2004 were the deluxe model? (Round to the nearest tenth percent.)The following table presents prices, in thousands of dollars, of single-family homes for 20 of the largest metropolitan areas in the United States for the first quarter of 2012 and the first quarter of 2013. . Metro Area 2012 2013 Boston, MA 311.5 332.2 Chicago, IL 157.2 159.4 Cincinnati, OH 112.5 121.0 Cleveland, OH 84.9 101.0 Dallas, TX 148.2 160.4 Denver, CO 226.4 261.2 Houston, TX 152.1 163.7 Los Angeles, CA 122.1 155.1 Miami, FL 182.0 219.9 Minneapolis, MN 147.3 170.6 Metro Area 2012 2013 New York, NY 363.8 368.2 Philadelphia, PA 193.5 197.7 Phoenix, AZ 129.9 169.0 Portland, OR 208.6 246.5 Riverside, CA 174.3 216.7 St. Louis, MO 103.7 111.0 San Diego, CA 359.5 412.3 San Francisco, CA 448.0…Suppose the price per share of stock for a sample of 25 companies was recorded at the beginning of the first financial quarter and then again at the end of the first financial quarter. How stocks perform during the first financial quarter is an indicator of what is ahead for the stock market and the economy. Company End of 1st quarter Beginning of 1st quarter Company 1 54.69 55.32 Company 2 56.20 78.52 Company 3 103.07 110.50 Company 4 80.45 85.08 Company 5 126.51 140.73 Company 6 133.23 137.28 Company 7 32.56 42.57 Company 8 51.41 54.54 Company 9 35.90 37.94 Company 10 14.55 19.48 Company 11 33.04 40.04 Company 12 45.33 40.36 Company 13 185.13 189.53 Company 14 109.28 109.45 Company 15 72.46 92.15 Company 16 49.32 55.03 Company 17 36.70 43.73 Company 18 79.57 86.18 Company 19 95.50 87.45 Company 20 43.09 47.09 Company 21 51.32 66.70 Company 22 77.45 86.53 Company 23 46.77 45.99 Company 24 46.45 48.13 Company 25 130.36 129.08 (a)…
- The following table shows a data set containing information for 25 of the shadow stocks tracked by the American Association of Individual Investors (aaii.com, February 2002). Shadow stocks are common stocks of smaller companies that are not closely followed by Wall Street analysts. Click on the datafile logo to reference the data. For the Exchange variable, show the "frequency and the percent frequency" for AMEX, NYSE, and OTC. Frequency & Percent Frequency for each: AMEX (? ) (? ), NYSE (? ) (? ), OTC ( ? ) ( ? ) Total (? ) (? )The following information is taken from Johnson & Johnson's annual reports. Its common stock is listed on the New York Stock Exchange, using the symbol JNJ. Johnson & Johnson Domestic Sales International Sales Employees Year ($ million) $ Million Thousands 2010 29,437 32,124 114.0 2011 12,907 36,107 117.9 2012 29,830 37,394 127.6 2013 31,910 39,402 128.1 2014 34,782 39,548 126.5 2015 35,687 34,387 127.1 2016 37,811 34,079 126.4 2017 39,863 36,597 134.0 2018 41,884 39,697 135.1 Using the period 2010–12 as the base period, compute a simple index of international sales for each year from 2013 to 2018. (Round your answers to 1 decimal place.)The index (2010–2012 = 100) for selected years is: Year Index 2010 2011 2012 2013 2014 2015 2016 2017 2018 I have asked this question a few times and it hasn't been correct. I am very confused on this on. Also, am I putting anything for the…The following information is taken from Johnson & Johnson's annual reports. Its common stock is listed on the New York Stock Exchange, using the symbol JNJ. Johnson & Johnson Domestic Sales International Sales Employees Year ($ million) ($ million) (thousands) 2010 $ 29,437 $ 32,124 114.0 2011 12,907 36,107 117.9 2012 29,830 37,394 127.6 2013 31,910 39,402 128.1 2014 34,782 39,548 126.5 2015 35,687 34,387 127.1 2016 37,811 34,079 126.4 2017 39,863 36,587 134.0 2018 41,884 39,697 135.1
- (A) Socially conscious investors screen out stocks of alcohol and tobacco makers, firms with poor environmental records, and companies with poor labor practices. Some examples of "good," socially conscious companies are Johnson and Johnson, Dell Computers, Bank of America, and Home Depot. The question is, are such stocks overpriced? One measure of value is the P/E, or price-to-earnings ratio. High P/E ratios may indicate a stock is overpriced. For the S&P Stock Index of all major stocks, the mean P/E ratio is ? = 19.4. A random sample of 36 "socially conscious" stocks gave a P/E ratio sample mean of x = 17.6, with sample standard deviation s = 5.6. Does this indicate that the mean P/E ratio of all socially conscious stocks is different (either way) from the mean P/E ratio of the S&P Stock Index? Use ? = 0.05 i-What is the value of the sample test statistic? (Round your answer to three decimal places.) (B)Let x be a random variable that represents red blood cell count (RBC) in…Assuming the market research was done properly and the 40% is representative, how many sales are expected if the publisher attempts to sell to 5,000 homes?A company studied the number of lost-time accidents occurring at its Brownsville, Texas, plant. Historical records show that 6% of the employees suffered lost-time accidents last year. Management believes that a special safety program will reduce such accidents to 5% during the current year. In addition, it estimates that 15% of employees who had lost-timeaccidents last year will experience a lost-time accident during the current year. a. What percentage of the employees will experience lost-time accidents in both years?b. What percentage of the employees will suffer at least one lost-time accident over the two-year period?
- The following table shows the number of siblings and daily allowance of 12 students from a Grade 11 class:Identify the data collection method used in the following statements:1. A researcher investigates the influence of online payments on consumer spending.2. A local TV network asked the voters to indicate whom they voted as they exited the pollingbooth.3. The school administration asked the students whether they are willing to have an increase inlaboratory fees if there is an upgrade of computers.4. A social welfare organization gathers information on hospital patients with mental disorders.5. An investigator uses information from various business reports for analysis.Suppose a magazine ranks the best paying college degrees in a country. The following data show the median starting salary, the mid-career salary, and the percentage increase from starting salary to mid-career salary for the 20 college degrees with the highest mid-career salary. Degree Starting Salary Mid-Career Salary % Increase College Degree A 59,400 105,000 77 College Degree B 56,400 101,000 79 College Degree C 54,800 101,000 84 College Degree D 64,800 105,000 62 College Degree E 53,500 93,400 75 College Degree F 61,200 87,700 43 College Degree G 56,200 97,700 74 College Degree H 50,400 87,000 73 College Degree I 48,800 97,800 100 College Degree J 60,800 106,000 74 College Degree K 47,500 91,500 93 College Degree L 41,500 88,300 113 College Degree M 49,300 87,100 77 College Degree N 50,900 90,300 77 College Degree O 46,400 88,300 90 College Degree P 63,900 106,000 66 College Degree Q 93,000 155,000 67 College Degree R 50,700 99,600 96 College…