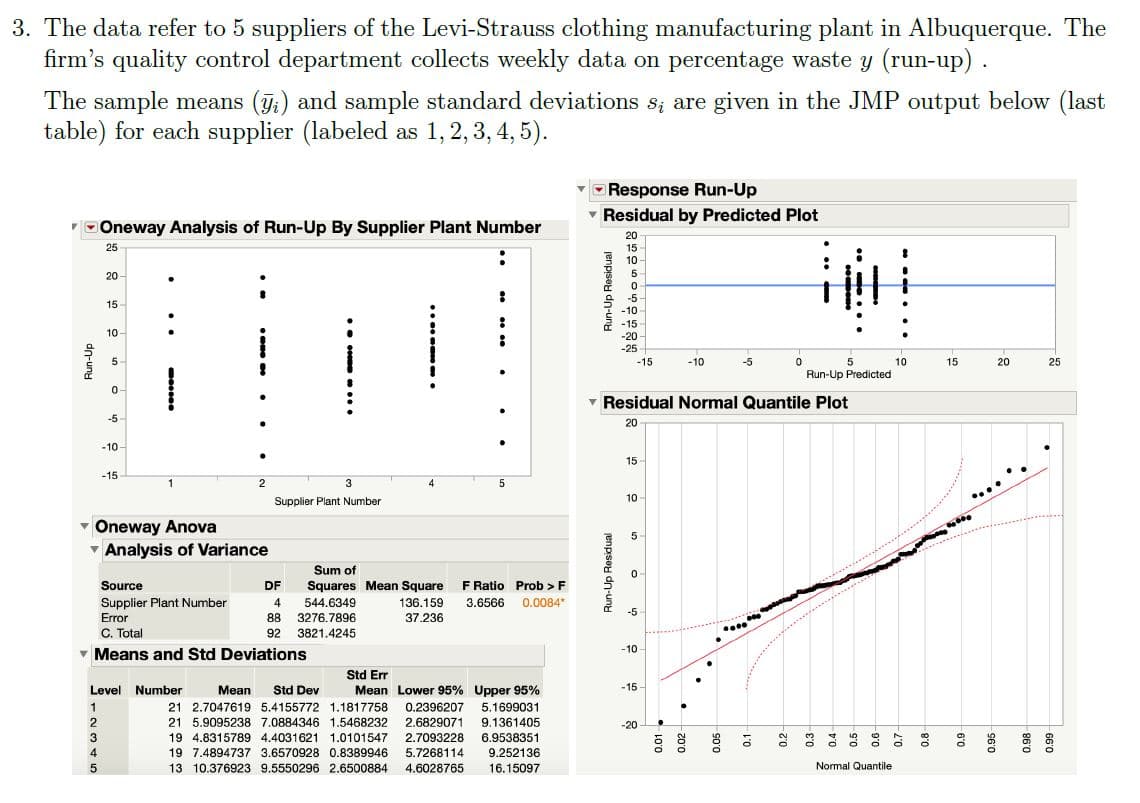
3. The data refer to 5 suppliers of the Levi-Strauss clothing manufacturing plant in Albuquerque. The firm's quality control department collects weekly data on percentage waste y (run-up). The sample means (;) and sample standard deviations S; are given in the JMP output below (last table) for each supplier (labeled as 1, 2, 3, 4, 5). Response Run-Up v Residual by Predicted Plot DOneway Analysis of Run-Up By Supplier Plant Number 20 25 15 10 20 -5 15 -10 -15 -20 -25 10 5- -15 -10 -5 10 15 20 25 Run-Up Predicted - Residual Normal Quantile Plot -5 20 -10- 15 -15 2 4 10 ... Supplier Plant Number Oneway Anova v Analysis of Variance Sum of Squares Mean Square 544.6349 F Ratio Prob > F 3.6566 Source DF Supplier Plant Number Error C. Total - Means and Std Deviations 4 136.159 0.0084" -5 88 3276.7896 37.236 92 3821.4245 -10 - Std Err Level Number Mean Std Dev Mean Lower 95% Upper 95% -15 - 21 2.7047619 5.4155772 1.1817758 0.2396207 2.6829071 2.7093228 5.1699031 21 5.9095238 7.0884346 1.5468232 9.1361405 -20 19 4.8315789 4.4031621 1.0101547 6.9538351 9.252136 16.15097 4 19 7.4894737 3.6570928 0.8389946 5.7268114 13 10.376923 9.5550296 2.6500884 4.6028765 Normal Quantile dn-uny Run-Up Residual Run-Up Residual 0.05 0.1 - -66'0
3. The data refer to 5 suppliers of the Levi-Strauss clothing manufacturing plant in Albuquerque. The firm's quality control department collects weekly data on percentage waste y (run-up). The sample means (;) and sample standard deviations S; are given in the JMP output below (last table) for each supplier (labeled as 1, 2, 3, 4, 5). Response Run-Up v Residual by Predicted Plot DOneway Analysis of Run-Up By Supplier Plant Number 20 25 15 10 20 -5 15 -10 -15 -20 -25 10 5- -15 -10 -5 10 15 20 25 Run-Up Predicted - Residual Normal Quantile Plot -5 20 -10- 15 -15 2 4 10 ... Supplier Plant Number Oneway Anova v Analysis of Variance Sum of Squares Mean Square 544.6349 F Ratio Prob > F 3.6566 Source DF Supplier Plant Number Error C. Total - Means and Std Deviations 4 136.159 0.0084" -5 88 3276.7896 37.236 92 3821.4245 -10 - Std Err Level Number Mean Std Dev Mean Lower 95% Upper 95% -15 - 21 2.7047619 5.4155772 1.1817758 0.2396207 2.6829071 2.7093228 5.1699031 21 5.9095238 7.0884346 1.5468232 9.1361405 -20 19 4.8315789 4.4031621 1.0101547 6.9538351 9.252136 16.15097 4 19 7.4894737 3.6570928 0.8389946 5.7268114 13 10.376923 9.5550296 2.6500884 4.6028765 Normal Quantile dn-uny Run-Up Residual Run-Up Residual 0.05 0.1 - -66'0

Glencoe Algebra 1, Student Edition, 9780079039897, 0079039898, 2018
18th Edition
ISBN:9780079039897
Author:Carter
Publisher:Carter
Chapter10: Statistics
Section10.4: Distributions Of Data
Problem 19PFA

Related questions
Question
Site image for background.
Using your previous answer to part (b), give two-sided 95% confidence limits for the difference in mean percentage waste for suppliers 3 an 4: u3 - u4.
Plug in but do not evaluate.
Transcribed Image Text:3. The data refer to 5 suppliers of the Levi-Strauss clothing manufacturing plant in Albuquerque. The
firm's quality control department collects weekly data on percentage waste y (run-up).
The sample means (;) and sample standard deviations S; are given in the JMP output below (last
table) for each supplier (labeled as 1, 2, 3, 4, 5).
Response Run-Up
v Residual by Predicted Plot
DOneway Analysis of Run-Up By Supplier Plant Number
20
25
15
10
20
-5
15
-10
-15
-20
-25
10
5-
-15
-10
-5
10
15
20
25
Run-Up Predicted
- Residual Normal Quantile Plot
-5
20
-10-
15
-15
2
4
10
...
Supplier Plant Number
Oneway Anova
v Analysis of Variance
Sum of
Squares Mean Square
544.6349
F Ratio Prob > F
3.6566
Source
DF
Supplier Plant Number
Error
C. Total
- Means and Std Deviations
4
136.159
0.0084"
-5
88 3276.7896
37.236
92 3821.4245
-10 -
Std Err
Level Number
Mean
Std Dev
Mean Lower 95% Upper 95%
-15 -
21 2.7047619 5.4155772 1.1817758
0.2396207
2.6829071
2.7093228
5.1699031
21 5.9095238 7.0884346 1.5468232
9.1361405
-20
19 4.8315789 4.4031621 1.0101547
6.9538351
9.252136
16.15097
4
19 7.4894737 3.6570928 0.8389946
5.7268114
13 10.376923 9.5550296 2.6500884
4.6028765
Normal Quantile
dn-uny
Run-Up Residual
Run-Up Residual
0.05
0.1 -
-66'0
Expert Solution
This question has been solved!
Explore an expertly crafted, step-by-step solution for a thorough understanding of key concepts.

This is a popular solution!

Trending now
This is a popular solution!

Step by step
Solved in 3 steps with 4 images

Knowledge Booster


Learn more about
Need a deep-dive on the concept behind this application? Look no further. Learn more about this topic, statistics and related others by exploring similar questions and additional content below.Recommended textbooks for you
Glencoe Algebra 1, Student Edition, 9780079039897…
Algebra
ISBN:
9780079039897
Author:
Carter
Publisher:
McGraw Hill
Glencoe Algebra 1, Student Edition, 9780079039897…
Algebra
ISBN:
9780079039897
Author:
Carter
Publisher:
McGraw Hill