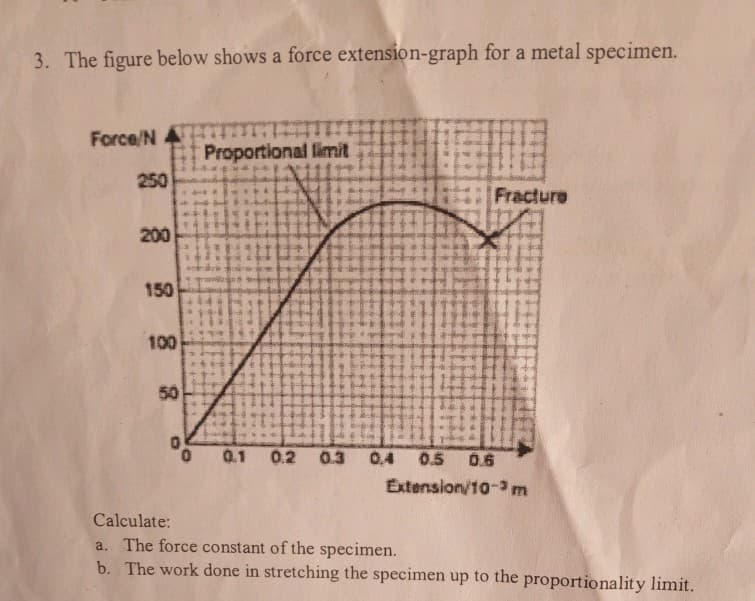
3. The figure below shows a force extension-graph for a metal specimen. Force/N 4 m Proportional limit 250 Fracture 200 150 100 50 0.1 0.2 0.3 0,4 0.5 0.6 Extension/10-3m Calculate: a. The force constant of the specimen. b. The work done in stretching the specimen up to the proportionality limit.
3. The figure below shows a force extension-graph for a metal specimen. Force/N 4 m Proportional limit 250 Fracture 200 150 100 50 0.1 0.2 0.3 0,4 0.5 0.6 Extension/10-3m Calculate: a. The force constant of the specimen. b. The work done in stretching the specimen up to the proportionality limit.

Related questions
Question
Transcribed Image Text:3. The figure below shows a force extension-graph for a metal specimen.
Force/N 4 m
Proportional limit
250
Fracture
200
150
100
50
0.1 0.2 0.3
0,4 0.5
0.6
Extension/10-3m
Calculate:
a. The force constant of the specimen.
b. The work done in stretching the specimen up to the proportionality limit.
Expert Solution
This question has been solved!
Explore an expertly crafted, step-by-step solution for a thorough understanding of key concepts.

This is a popular solution!

Trending now
This is a popular solution!

Step by step
Solved in 4 steps with 4 images
