-3.0 160 4.0 3.5 140 N +3.5 3.0 120 2.5 140 100 3 2.0 80 60 Z 10 40 05 20 Times 10 Tes Time is 10 Of all the graphs shown above, what plot type is correctly represented? O second order Ono plot shown is valid O 1st order 3rd order w l'o'NI
-3.0 160 4.0 3.5 140 N +3.5 3.0 120 2.5 140 100 3 2.0 80 60 Z 10 40 05 20 Times 10 Tes Time is 10 Of all the graphs shown above, what plot type is correctly represented? O second order Ono plot shown is valid O 1st order 3rd order w l'o'NI

Chapter2: Basic Statistical Analysis With Excel
Section: Chapter Questions
Problem 8P

Related questions
Question
Transcribed Image Text:Drowser
Time Limit: 0:20:00
Time Left:0:15:19
Glenton Morris: Attempt 1
160
40
3.0
Page 1:
140 -
35
3.0
120
10
25
100
2.0
80
60
Z 10
Page 2:
05-
20
0
2.
Time is 10
Timetsk 10
Page 3:
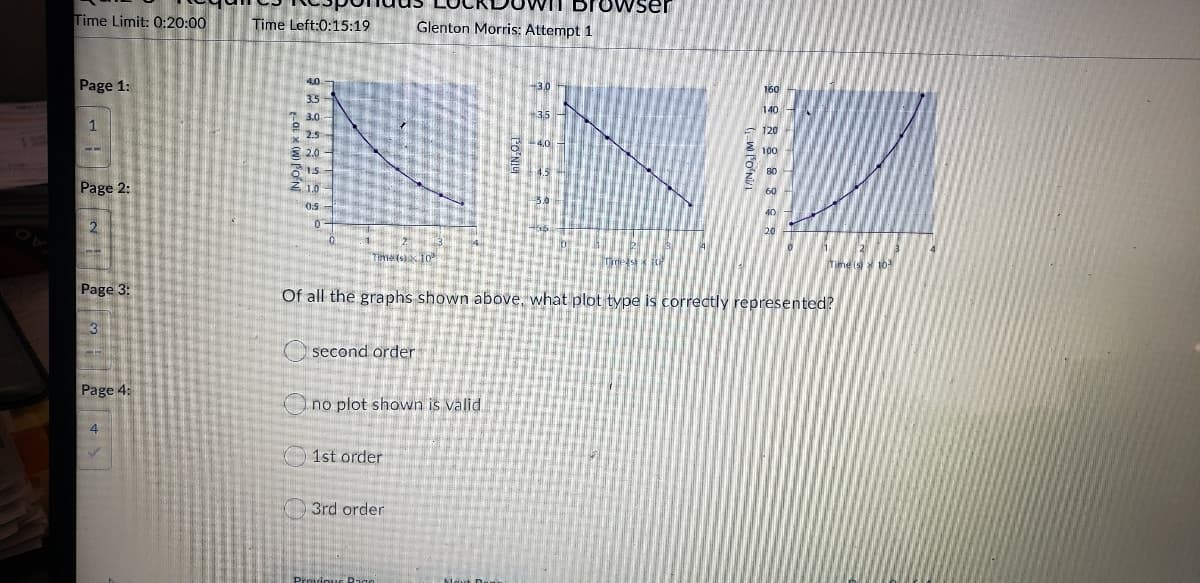
Of all the graphs shown above, what plot type is correctly represented?
O second order
Page 4:
O no plot shown is valid
4.
1st order
3rd order
OL X (W) FON
Expert Solution
This question has been solved!
Explore an expertly crafted, step-by-step solution for a thorough understanding of key concepts.

Step by step
Solved in 2 steps

Knowledge Booster


Learn more about
Need a deep-dive on the concept behind this application? Look no further. Learn more about this topic, chemistry and related others by exploring similar questions and additional content below.Recommended textbooks for you

Chemistry: Principles and Reactions
Chemistry
ISBN:
9781305079373
Author:
William L. Masterton, Cecile N. Hurley
Publisher:
Cengage Learning
Chemistry: Principles and Reactions
Chemistry
ISBN:
9781305079373
Author:
William L. Masterton, Cecile N. Hurley
Publisher:
Cengage Learning