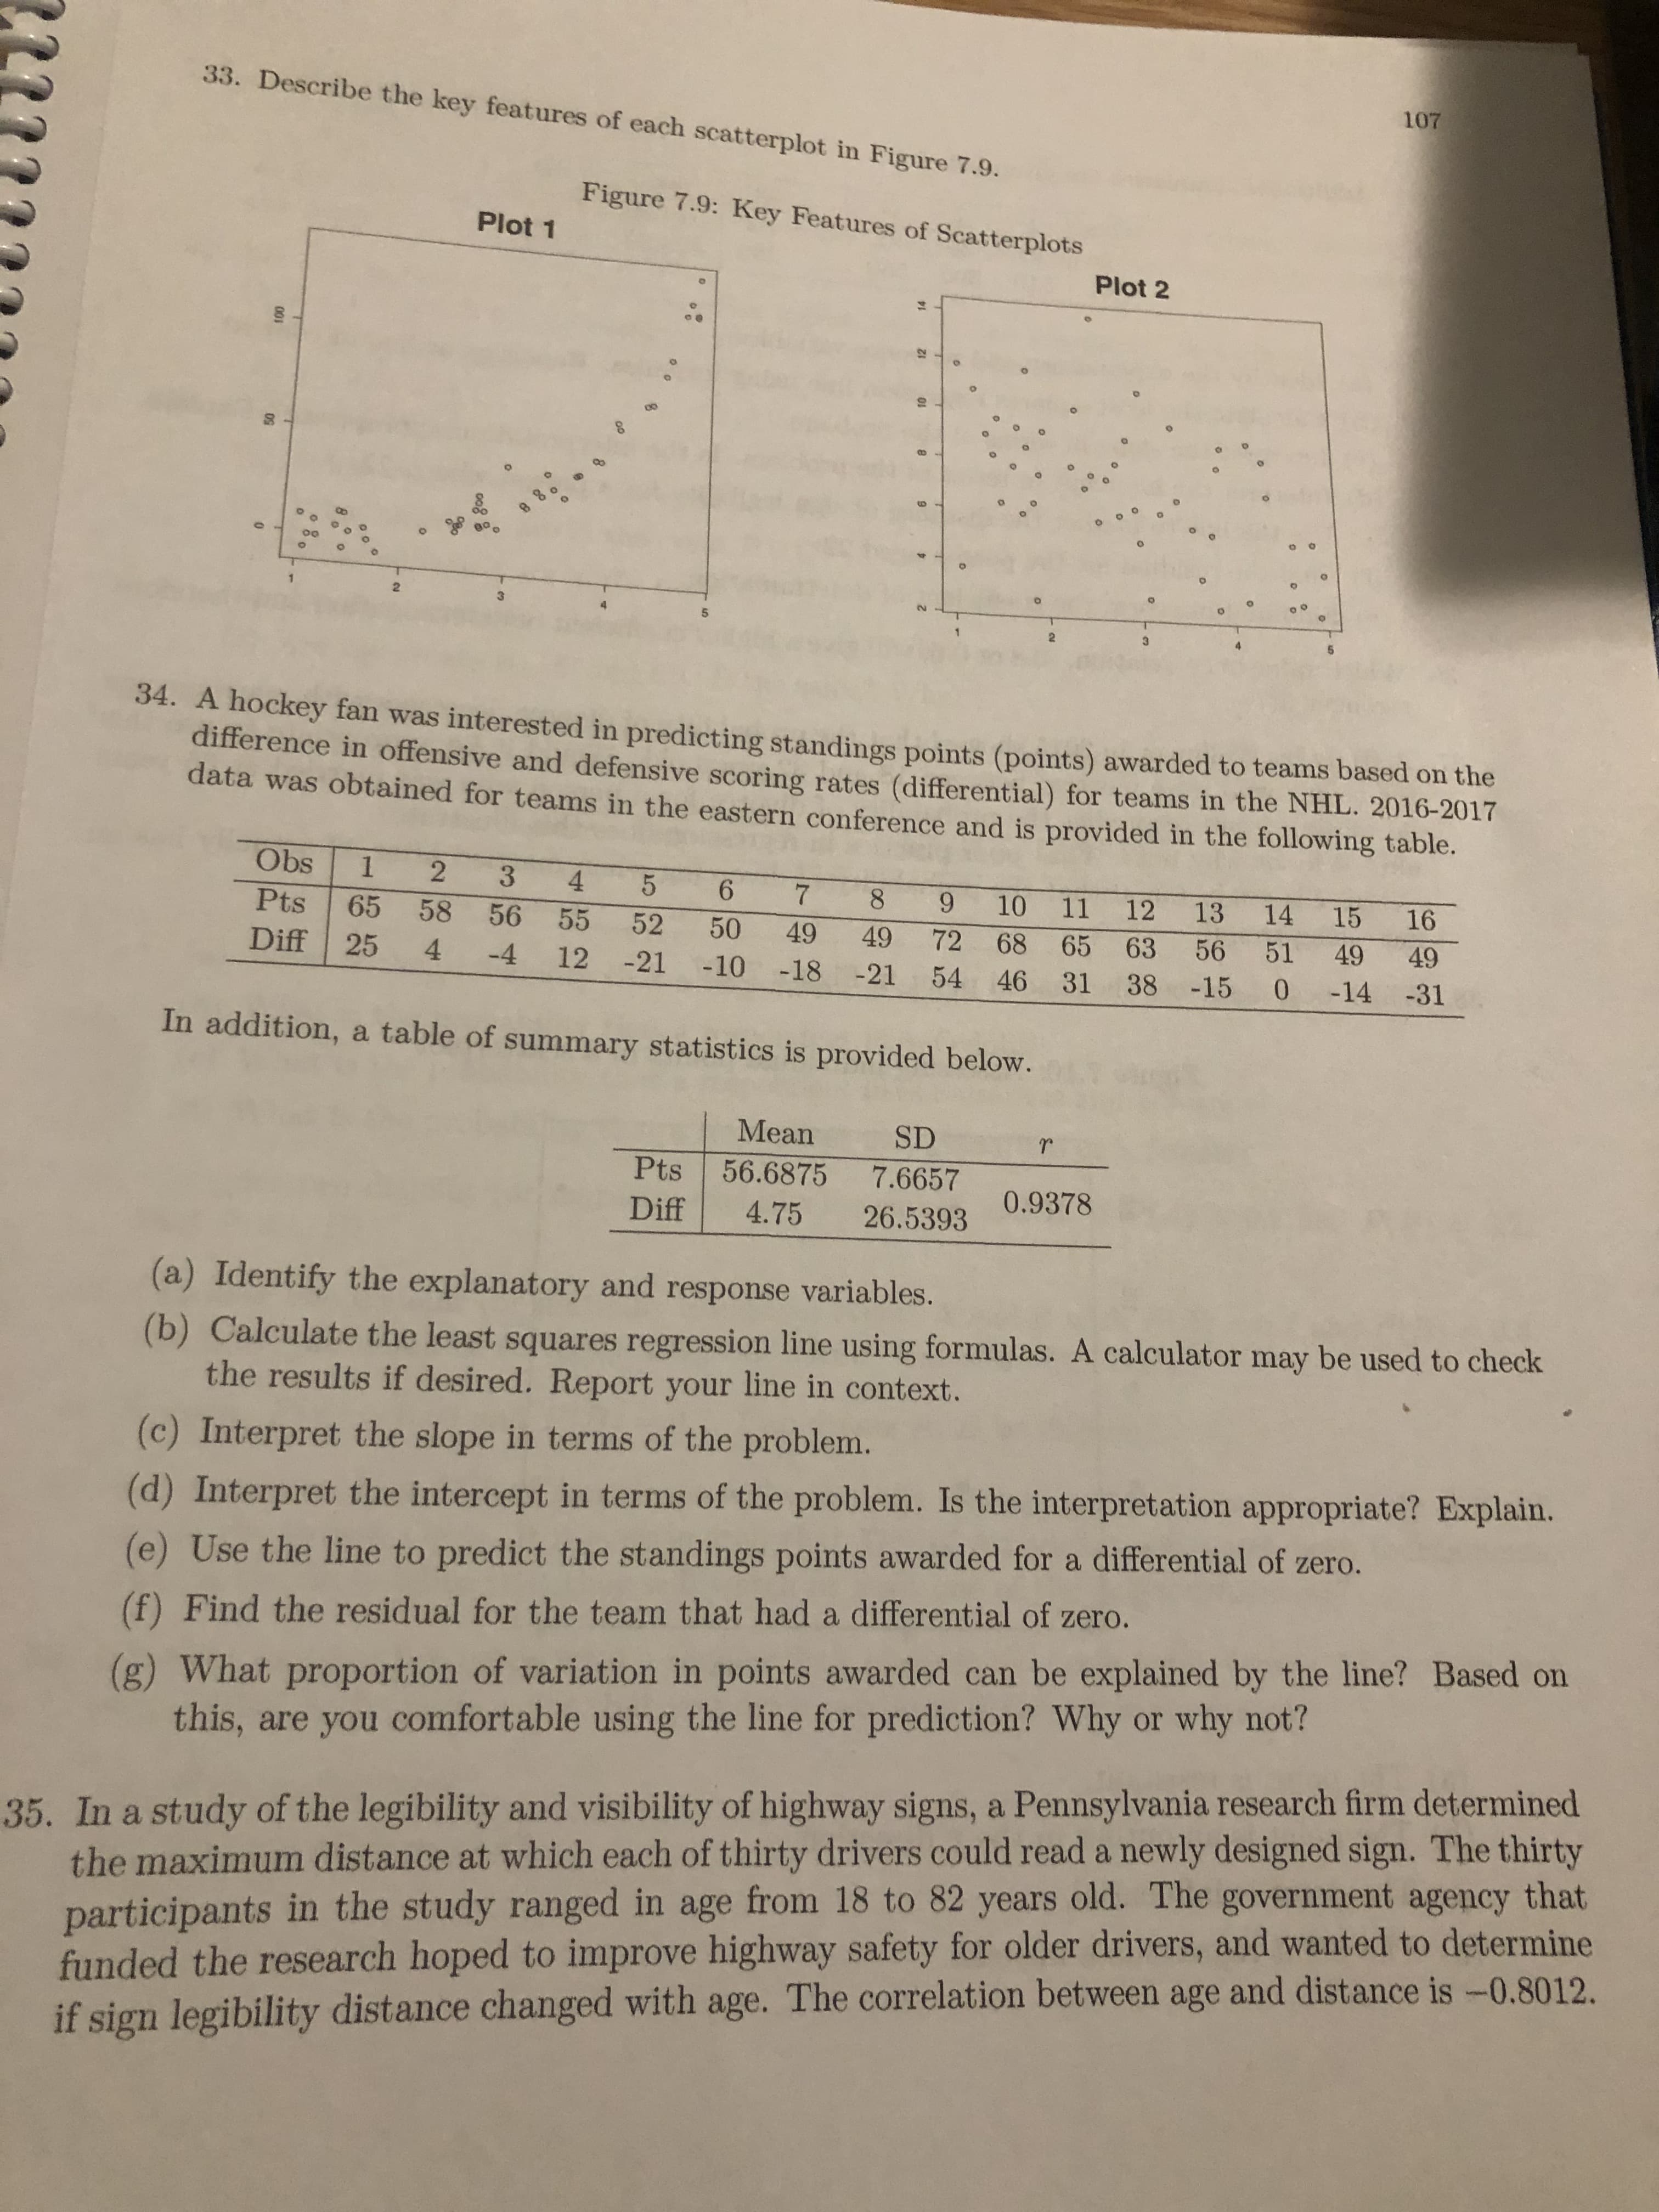
33. Describe the key features of each scatterplot in Figure 7.9. 107 Figure 7.9: Key Features of Scatterplots Plot 1 Plot 2 5. 34. A hockey fan was interested in predicting standings points (poits) awarded to teams based on the difference in offensive and defensive scoring rates (differential) for teams in the NHL. 2016-2017 data was obtained for teams in the eastern conference and is provided in the following table. Obs 3 4. 9 10 11 8. 12 13 14 15 16 Pts 65 58 56 55 52 50 49 49 72 68 51 65 63 56 49 49 Diff 25 4. -4 12 -21 -10 -21 -18 54 46 38 -15 31 -14 -31 In addition, a table of summary statistics is provided below. Mean SD Pts 56.6875 7.6657 0.9378 Diff 4.75 26.5393 (a) Identify the explanatory and response variables. (b) Calculate the least squares regression line using formulas. A calculator may be used to check the results if desired. Report your line in context. (c) Interpret the slope in terms of the problem. (d) Interpret the intercept in terms of the problem. Is the interpretation appropriate? Explain. (e) Use the line to predict the standings points awarded for a differential of zero. (f) Find the residual for the team that had a differential of zero. (g) What proportion of variation in points awarded can be explained by the line? Based on this, are you comfortable using the line for prediction? Why or why not? 35. In a study of the legibility and visibility of highway signs, a Pennsylvania research firm determined the maximum distance at which each of thirty drivers could read a newly designed sign. The thirty participants in the study ranged in age from 18 to 82 years old. The government agency that funded the research hoped to improve highway safety for older drivers, and wanted to determine if sign legibility distance changed with age. The correlation between age and distance is -0.8012. 2. 14 008 001


Addition Rule of Probability
It simply refers to the likelihood of an event taking place whenever the occurrence of an event is uncertain. The probability of a single event can be calculated by dividing the number of successful trials of that event by the total number of trials.
Expected Value
When a large number of trials are performed for any random variable ‘X’, the predicted result is most likely the mean of all the outcomes for the random variable and it is known as expected value also known as expectation. The expected value, also known as the expectation, is denoted by: E(X).
Probability Distributions
Understanding probability is necessary to know the probability distributions. In statistics, probability is how the uncertainty of an event is measured. This event can be anything. The most common examples include tossing a coin, rolling a die, or choosing a card. Each of these events has multiple possibilities. Every such possibility is measured with the help of probability. To be more precise, the probability is used for calculating the occurrence of events that may or may not happen. Probability does not give sure results. Unless the probability of any event is 1, the different outcomes may or may not happen in real life, regardless of how less or how more their probability is.
Basic Probability
The simple definition of probability it is a chance of the occurrence of an event. It is defined in numerical form and the probability value is between 0 to 1. The probability value 0 indicates that there is no chance of that event occurring and the probability value 1 indicates that the event will occur. Sum of the probability value must be 1. The probability value is never a negative number. If it happens, then recheck the calculation.
Question 34 parts e, f, and g.


Trending now
This is a popular solution!

Step by step
Solved in 2 steps


