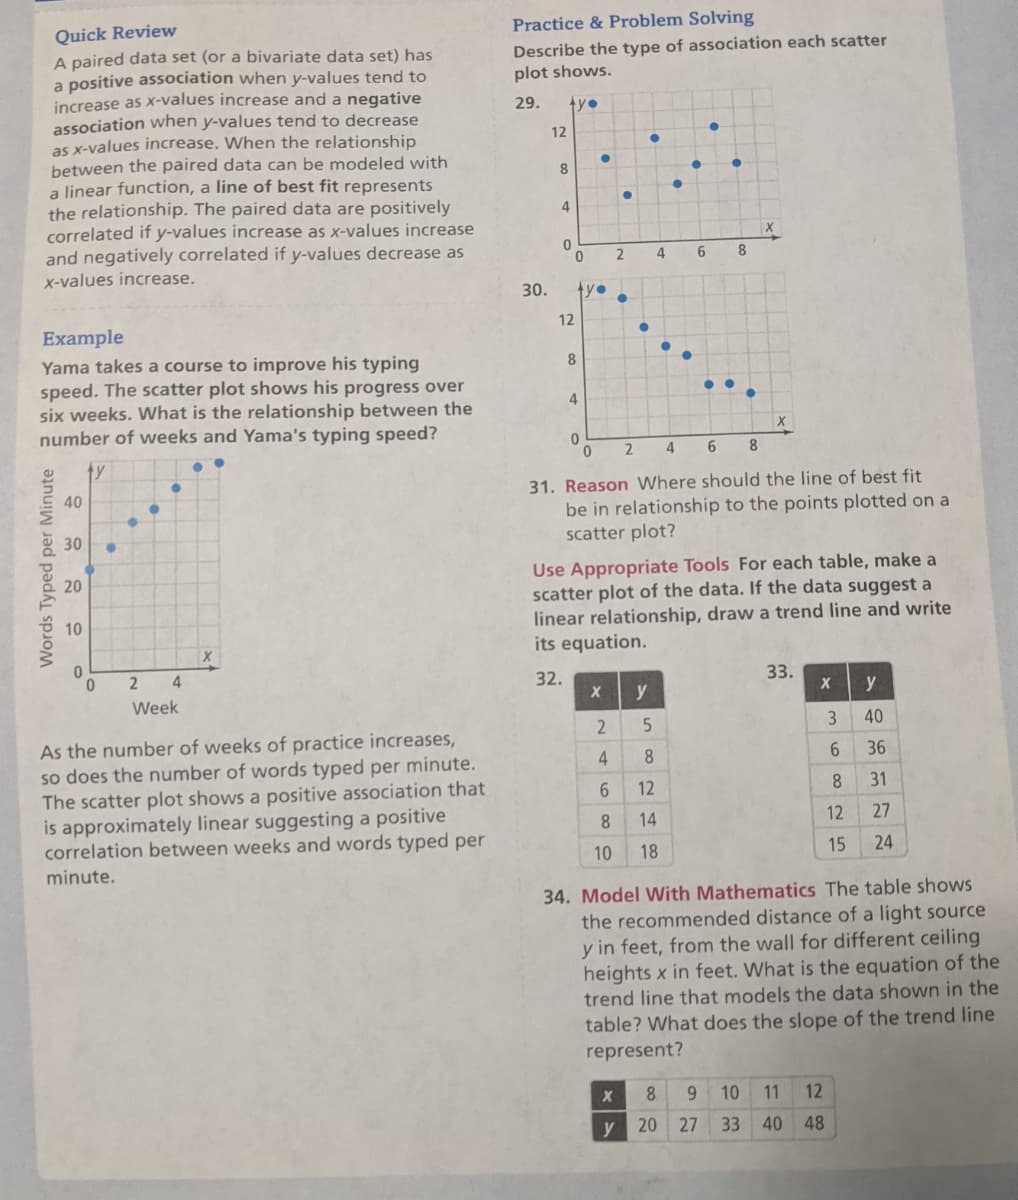
34. Model With Mathematics The tabl the recommended distance of a lig y in feet, from the wall for differer heights x in feet. What is the equa trend line that models the data she table? What does the slope of the represent? 8. 10 11 12 y 20 27 33 40 48

Big Ideas Math A Bridge To Success Algebra 1: Student Edition 2015
1st Edition
ISBN:9781680331141
Author:HOUGHTON MIFFLIN HARCOURT
Publisher:HOUGHTON MIFFLIN HARCOURT
Chapter4: Writing Linear Equations
Section4.5: Analyzing Lines Of Fit
Problem 27E
icon
Related questions
icon
Concept explainers
Topic Video
Question
100%
Question 34
Quick Review
A paired data set (or a bivariate data set) has
a positive association when y-values tend to
increase as x-values increase and a negative
association when y-values tend to decrease
as x-values increase. When the relationship
between the paired data can be modeled with
a linear function, a line of best fit represents
the relationship. The paired data are positively
correlated if y-values increase as x-values increase
and negatively correlated if y-values decrease as
X-values increase.
Practice & Problem Solving
Describe the type of association each scatter
plot shows.
29.
12
8
4
2.
4
6.
8
30.
ty•
12
Example
Yama takes a course to improve his typing
speed. The scatter plot shows his progress over
six weeks. What is the relationship between the
number of weeks and Yama's typing speed?
8
4
2
6.
8.
ty
31. Reason Where should the line of best fit
be in relationship to the points plotted on a
scatter plot?
40
30
Use Appropriate Tools For each table, make a
scatter plot of the data. If the data suggest a
linear relationship, draw a trend line and write
its equation.
20
10
4
32.
33.
y
y
Week
3
40
As the number of weeks of practice increases,
so does the number of words typed per minute.
The scatter plot shows a positive association that
is approximately linear suggesting a positive
correlation between weeks and words typed per
8.
36
12
31
8
14
12
27
10
18
15
24
minute.
34. Model With Mathematics The table shows
the recommended distance of a light source
y in feet, from the wall for different ceiling
heights x in feet. What is the equation of the
trend line that models the data shown in the
table? What does the slope of the trend line
represent?
8.
9.
10
11
12
y 20 27
33 40 48
Words Typed per Minute
Transcribed Image Text:Quick Review A paired data set (or a bivariate data set) has a positive association when y-values tend to increase as x-values increase and a negative association when y-values tend to decrease as x-values increase. When the relationship between the paired data can be modeled with a linear function, a line of best fit represents the relationship. The paired data are positively correlated if y-values increase as x-values increase and negatively correlated if y-values decrease as X-values increase. Practice & Problem Solving Describe the type of association each scatter plot shows. 29. 12 8 4 2. 4 6. 8 30. ty• 12 Example Yama takes a course to improve his typing speed. The scatter plot shows his progress over six weeks. What is the relationship between the number of weeks and Yama's typing speed? 8 4 2 6. 8. ty 31. Reason Where should the line of best fit be in relationship to the points plotted on a scatter plot? 40 30 Use Appropriate Tools For each table, make a scatter plot of the data. If the data suggest a linear relationship, draw a trend line and write its equation. 20 10 4 32. 33. y y Week 3 40 As the number of weeks of practice increases, so does the number of words typed per minute. The scatter plot shows a positive association that is approximately linear suggesting a positive correlation between weeks and words typed per 8. 36 12 31 8 14 12 27 10 18 15 24 minute. 34. Model With Mathematics The table shows the recommended distance of a light source y in feet, from the wall for different ceiling heights x in feet. What is the equation of the trend line that models the data shown in the table? What does the slope of the trend line represent? 8. 9. 10 11 12 y 20 27 33 40 48 Words Typed per Minute
Expert Solution
Step 1

Explanation and solutions is given below....

trending now

Trending now

This is a popular solution!

steps

Step by step

Solved in 2 steps with 1 images

Blurred answer
Follow-up Questions
Read through expert solutions to related follow-up questions below.
Follow-up Question

What does the slope of the trend line represent?

Solution
Bartleby Expert
SEE SOLUTION
Knowledge Booster
Sample space, Events, and Basic Rules of Probability
Learn more about
Need a deep-dive on the concept behind this application? Look no further. Learn more about this topic, algebra and related others by exploring similar questions and additional content below.
Recommended textbooks for you
Big Ideas Math A Bridge To Success Algebra 1: Stu…
Algebra
ISBN:
9781680331141
Author:
HOUGHTON MIFFLIN HARCOURT
Publisher:
Houghton Mifflin Harcourt
Functions and Change: A Modeling Approach to Coll…
Algebra
ISBN:
9781337111348
Author:
Bruce Crauder, Benny Evans, Alan Noell
Publisher:
Cengage Learning
College Algebra
College Algebra
Algebra
ISBN:
9781305115545
Author:
James Stewart, Lothar Redlin, Saleem Watson
Publisher:
Cengage Learning
Algebra and Trigonometry (MindTap Course List)
Algebra
ISBN:
9781305071742
Author:
James Stewart, Lothar Redlin, Saleem Watson
Publisher:
Cengage Learning
Glencoe Algebra 1, Student Edition, 9780079039897…
Algebra
ISBN:
9780079039897
Author:
Carter
Publisher:
McGraw Hill
Algebra & Trigonometry with Analytic Geometry
Algebra
ISBN:
9781133382119
Author:
Swokowski
Publisher:
Cengage