38,0 43.1 55.9 494 46,2 41,4 43.4 41.9 45,6 43,4 51.4 42.4 63.3 51,3 61.0 32.4 54,2 32.9 50,7 40.4 51.5 41,4 -41.9 46.1 46.4 42.9 588 53,2 S0S 380 40.4 670 43.4 35,7 40,9 41.9 (DC) 48.6 39,8 37.4 35.4 372 40.2 35.2 39.3 39,3 Greater than 47.7 37.2 63.5 38.4 400-47.7 384 52.8 Less than 400 U.S. AVERAGE: 47,7 264 NM 37.2 AK 26.4 ID AL 39.3 HI MA SD 63.5 41.9 42.4 MI NY 63.3 TN 39.8 43.4 54.2 AR 40.2 IL 58.8 53.2 MN NC 48.6 ND 41.4 TX 45.6 38.4 MS MO AZ 37.4 IA IN UT 42.9 37.2 OH 46.4 CA 67.0 CO 40.4 CT 61.0 DE 41.4 DC 41.9 VT 40.4 35.7 43.1 OK 35.4 KS 43.4 MT 46.2 VA 38.0 KY 40.9 NE OR 43.4 WA 55.9 46.1 WV 50.6 LA 38.4 NV 51.5 PA 50.7 ME 49.4 NH 38.0 RI WI 51.3 51.4 SC 35.2 MD 41.9 NJ FL 52.8 WY 32.4 32.9 GA 39.3 Source: http://www.api.org/statistics/fueltaxes/upload/GASOLINE_ TAX_MAP_ APRIL2010.pdf, July 6, 2010
38,0 43.1 55.9 494 46,2 41,4 43.4 41.9 45,6 43,4 51.4 42.4 63.3 51,3 61.0 32.4 54,2 32.9 50,7 40.4 51.5 41,4 -41.9 46.1 46.4 42.9 588 53,2 S0S 380 40.4 670 43.4 35,7 40,9 41.9 (DC) 48.6 39,8 37.4 35.4 372 40.2 35.2 39.3 39,3 Greater than 47.7 37.2 63.5 38.4 400-47.7 384 52.8 Less than 400 U.S. AVERAGE: 47,7 264 NM 37.2 AK 26.4 ID AL 39.3 HI MA SD 63.5 41.9 42.4 MI NY 63.3 TN 39.8 43.4 54.2 AR 40.2 IL 58.8 53.2 MN NC 48.6 ND 41.4 TX 45.6 38.4 MS MO AZ 37.4 IA IN UT 42.9 37.2 OH 46.4 CA 67.0 CO 40.4 CT 61.0 DE 41.4 DC 41.9 VT 40.4 35.7 43.1 OK 35.4 KS 43.4 MT 46.2 VA 38.0 KY 40.9 NE OR 43.4 WA 55.9 46.1 WV 50.6 LA 38.4 NV 51.5 PA 50.7 ME 49.4 NH 38.0 RI WI 51.3 51.4 SC 35.2 MD 41.9 NJ FL 52.8 WY 32.4 32.9 GA 39.3 Source: http://www.api.org/statistics/fueltaxes/upload/GASOLINE_ TAX_MAP_ APRIL2010.pdf, July 6, 2010

College Algebra (MindTap Course List)
12th Edition
ISBN:9781305652231
Author:R. David Gustafson, Jeff Hughes
Publisher:R. David Gustafson, Jeff Hughes
Chapter8: Sequences, Series, And Probability
Section8.CT: Chapter Test
Problem 16CT: How many six-digit license plates can be made if no plate begins with 0 or 1?

Related questions

Question
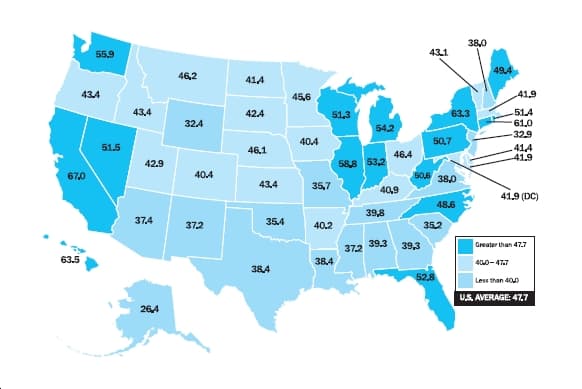
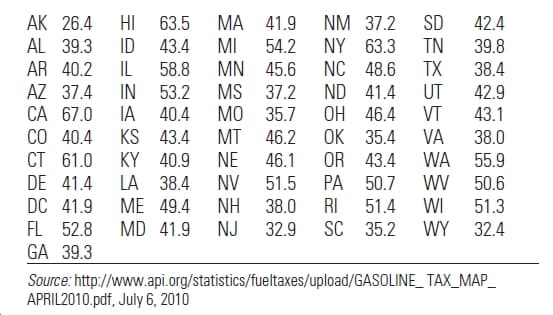
The following are the 2010 state gasoline tax in cents per gallon for the 50
U.S. states and the District of Columbia.
See Attachment
a. Construct a stem and leaf display for the data.
b. How would you describe the shape of this distribution?
c. Are there states with unusually high or low gasoline taxes? If so, which states are they?
Transcribed Image Text:38,0
43.1
55.9
494
46,2
41,4
43.4
41.9
45,6
43,4
51.4
42.4
63.3
51,3
61.0
32.4
54,2
32.9
50,7
40.4
51.5
41,4
-41.9
46.1
46.4
42.9
588 53,2
S0S 380
40.4
670
43.4
35,7
40,9
41.9 (DC)
48.6
39,8
37.4
35.4
372
40.2
35.2
39.3
39,3
Greater than 47.7
37.2
63.5
38.4
400-47.7
384
52.8
Less than 400
U.S. AVERAGE: 47,7
264
Transcribed Image Text:NM 37.2
AK 26.4
ID
AL 39.3
HI
MA
SD
63.5
41.9
42.4
MI
NY 63.3
TN
39.8
43.4
54.2
AR 40.2
IL
58.8
53.2
MN
NC 48.6
ND 41.4
TX
45.6
38.4
MS
MO
AZ 37.4
IA
IN
UT
42.9
37.2
OH 46.4
CA 67.0
CO 40.4
CT 61.0
DE 41.4
DC 41.9
VT
40.4
35.7
43.1
OK 35.4
KS 43.4
MT
46.2
VA
38.0
KY 40.9
NE
OR 43.4
WA
55.9
46.1
WV 50.6
LA 38.4
NV 51.5
PA 50.7
ME 49.4
NH 38.0
RI
WI
51.3
51.4
SC 35.2
MD 41.9
NJ
FL 52.8
WY
32.4
32.9
GA 39.3
Source: http://www.api.org/statistics/fueltaxes/upload/GASOLINE_ TAX_MAP_
APRIL2010.pdf, July 6, 2010
Expert Solution
This question has been solved!
Explore an expertly crafted, step-by-step solution for a thorough understanding of key concepts.

This is a popular solution!

Trending now
This is a popular solution!

Step by step
Solved in 2 steps with 1 images

Knowledge Booster


Learn more about
Need a deep-dive on the concept behind this application? Look no further. Learn more about this topic, probability and related others by exploring similar questions and additional content below.Recommended textbooks for you
College Algebra (MindTap Course List)
Algebra
ISBN:
9781305652231
Author:
R. David Gustafson, Jeff Hughes
Publisher:
Cengage Learning

Holt Mcdougal Larson Pre-algebra: Student Edition…
Algebra
ISBN:
9780547587776
Author:
HOLT MCDOUGAL
Publisher:
HOLT MCDOUGAL
College Algebra (MindTap Course List)
Algebra
ISBN:
9781305652231
Author:
R. David Gustafson, Jeff Hughes
Publisher:
Cengage Learning
Holt Mcdougal Larson Pre-algebra: Student Edition…
Algebra
ISBN:
9780547587776
Author:
HOLT MCDOUGAL
Publisher:
HOLT MCDOUGAL