3a. write the hypotheses in symbolic form determine if the test is right tailed left tailed or two tailed and explain why. 3b. calculate the critical value the test statistic and P value. show calculations below. explain your calculations and include your results. Critical value Test statistic P-value 3c. make a decision about the null hypothesis using both the critical value and P value methods. explain how you arrived at your results. 3d. restate your conclusion in non-technical terms.
3a. write the hypotheses in symbolic form determine if the test is right tailed left tailed or two tailed and explain why. 3b. calculate the critical value the test statistic and P value. show calculations below. explain your calculations and include your results. Critical value Test statistic P-value 3c. make a decision about the null hypothesis using both the critical value and P value methods. explain how you arrived at your results. 3d. restate your conclusion in non-technical terms.

MATLAB: An Introduction with Applications
6th Edition
ISBN:9781119256830
Author:Amos Gilat
Publisher:Amos Gilat
Chapter1: Starting With Matlab
Section: Chapter Questions
Problem 1P

Related questions
Question
3a. write the hypotheses in symbolic form determine if the test is right tailed left tailed or two tailed and explain why.
3b. calculate the critical value the test statistic and P value. show calculations below. explain your calculations and include your results.
Critical value
Test statistic
P-value
3c. make a decision about the null hypothesis using both the critical value and P value methods. explain how you arrived at your results.
3d. restate your conclusion in non-technical terms.
Transcribed Image Text:2
WN
3
LE Copy
Format Painter
Clipboard
4
15
16
17
18
19
20
21
A
22
23
24
25
26
27
28
29
Ready
V
:
B
Calibri
Page Layout
B I Uv
✓ fx
C
Month
January
Febrary
March
April
May
June
July
August
September
October
November
December
✓11
Font
D
Type here to search
Formulas Data Review View
2019
2187
2722
3383
3043
3018
2796
3093
3988
2594
2721
3038
4044
E
Question 1 Question 2 Question 3
Accessibility: Investigate
A A
a Wrap Text
~A~ 三三三 EE Merge & Center
==
17
2020
2148
2701
1686
462
1624
2692
2722
2822
2643
2677
2617
3824
F
ab
G
Af
Alignment
PALER
n
df
H
d
Sd
Samples_08092022 • Saved ✓
Help
п с
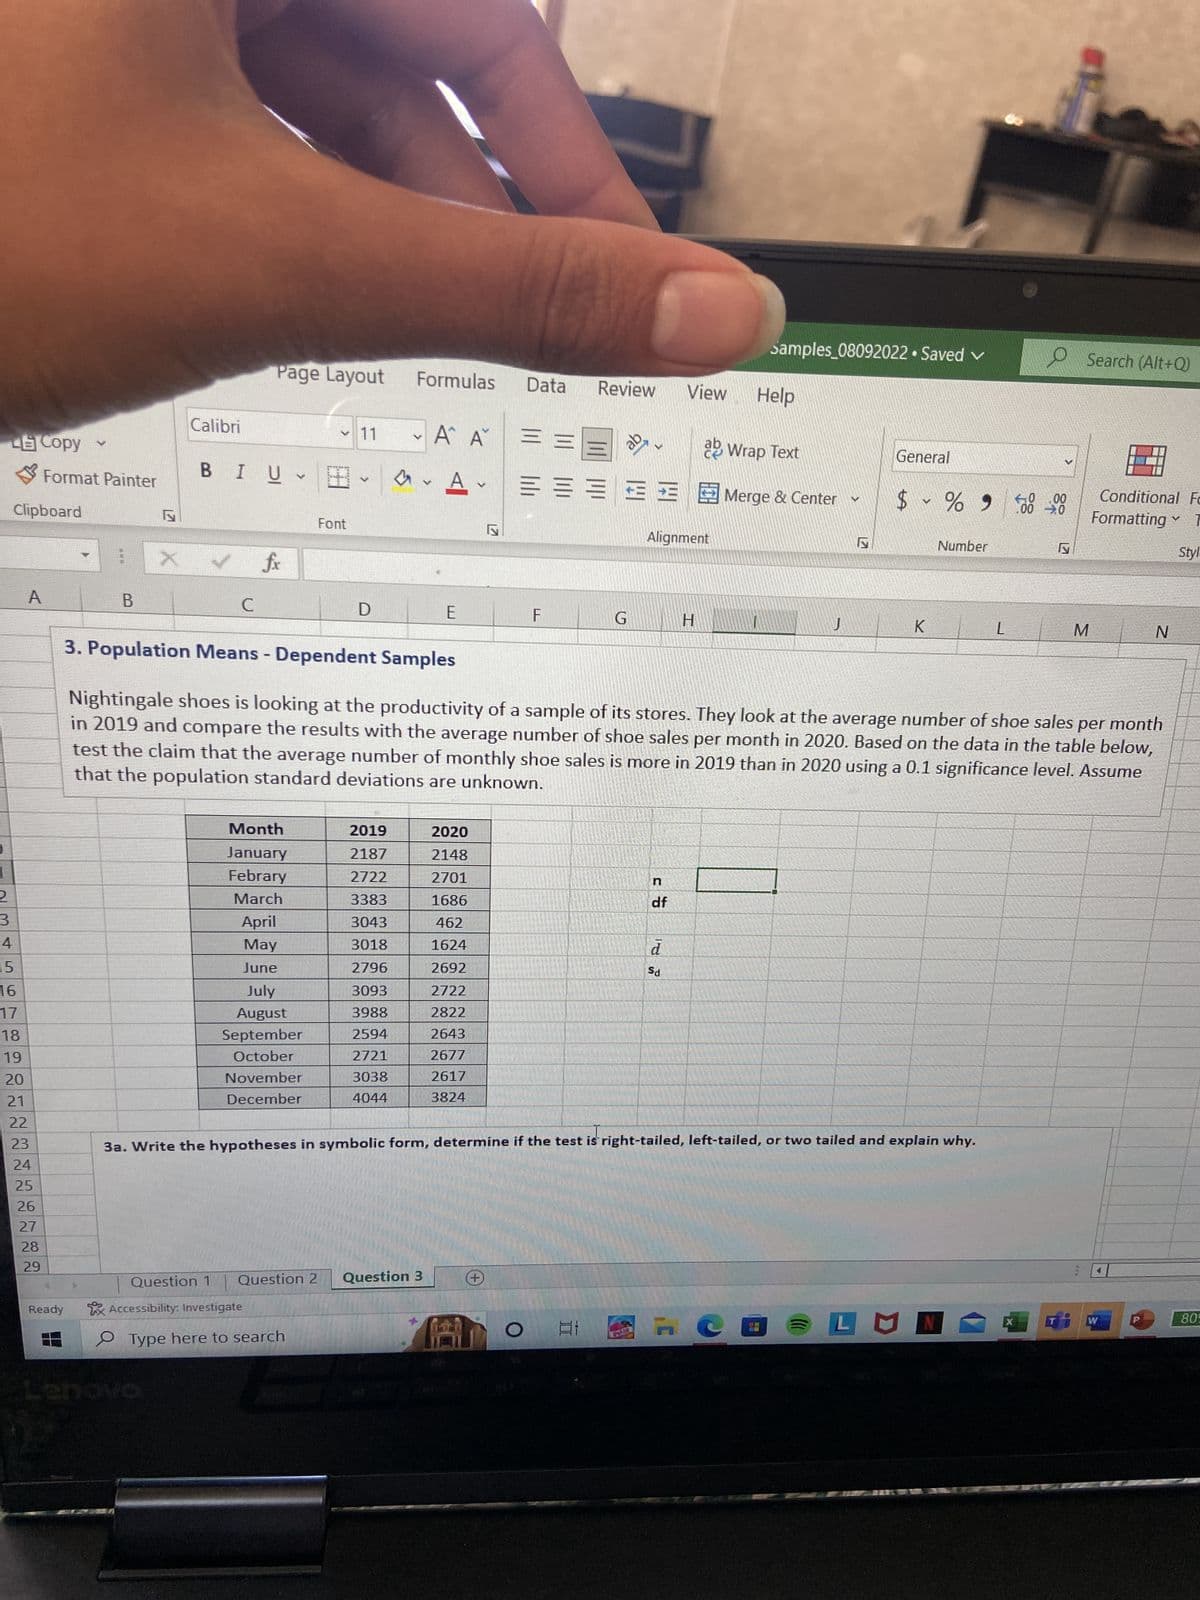
3. Population Means - Dependent Samples
Nightingale shoes is looking at the productivity of a sample of its stores. They look at the average number of shoe sales per month
in 2019 and compare the results with the average number of shoe sales per month in 2020. Based on the data in the table below,
test the claim that the average number of monthly shoe sales is more in 2019 than in 2020 using a 0.1 significance level. Assume
that the population standard deviations are unknown.
J
3a. Write the hypotheses in symbolic form, determine if the test is right-tailed, left-tailed, or two tailed and explain why.
4
General
%
V
$ % 9
K
Number
L
LUN
V
-0.00
.00 ➜.0
Search (Alt+Q)
M
Conditional Fe
Formatting 1
Styl
N
W
V
809
Expert Solution
This question has been solved!
Explore an expertly crafted, step-by-step solution for a thorough understanding of key concepts.

This is a popular solution!

Trending now
This is a popular solution!

Step by step
Solved in 4 steps with 2 images

Recommended textbooks for you
MATLAB: An Introduction with Applications
Statistics
ISBN:
9781119256830
Author:
Amos Gilat
Publisher:
John Wiley & Sons Inc

Probability and Statistics for Engineering and th…
Statistics
ISBN:
9781305251809
Author:
Jay L. Devore
Publisher:
Cengage Learning

Statistics for The Behavioral Sciences (MindTap C…
Statistics
ISBN:
9781305504912
Author:
Frederick J Gravetter, Larry B. Wallnau
Publisher:
Cengage Learning
MATLAB: An Introduction with Applications
Statistics
ISBN:
9781119256830
Author:
Amos Gilat
Publisher:
John Wiley & Sons Inc
Probability and Statistics for Engineering and th…
Statistics
ISBN:
9781305251809
Author:
Jay L. Devore
Publisher:
Cengage Learning
Statistics for The Behavioral Sciences (MindTap C…
Statistics
ISBN:
9781305504912
Author:
Frederick J Gravetter, Larry B. Wallnau
Publisher:
Cengage Learning

Elementary Statistics: Picturing the World (7th E…
Statistics
ISBN:
9780134683416
Author:
Ron Larson, Betsy Farber
Publisher:
PEARSON

The Basic Practice of Statistics
Statistics
ISBN:
9781319042578
Author:
David S. Moore, William I. Notz, Michael A. Fligner
Publisher:
W. H. Freeman

Introduction to the Practice of Statistics
Statistics
ISBN:
9781319013387
Author:
David S. Moore, George P. McCabe, Bruce A. Craig
Publisher:
W. H. Freeman