4. Facebook wants to maximize the visibility of businesses on who advertise on their platform. This visibility is measured by the number of clicks an advertisement gets. Facebook has come up with a new home page design that puts the advertisements halfway through the page. However, they do not know how this will effect advertisement visibility. They test what the change in the average number of clicks per user is by assigning 35 people to the new design and 30 people to the old design and measuring the results across multiple days (this is called an A/B test). The new design had an average of 15 clicks per user with standard deviation 7 and the old design had an average of 6 clicks per user with standard deviation of 2. Does the mean clicks per user differ between the new homepage and the old homepage? Test this hypothesis at the a = 0.05 level.
4. Facebook wants to maximize the visibility of businesses on who advertise on their platform. This visibility is measured by the number of clicks an advertisement gets. Facebook has come up with a new home page design that puts the advertisements halfway through the page. However, they do not know how this will effect advertisement visibility. They test what the change in the average number of clicks per user is by assigning 35 people to the new design and 30 people to the old design and measuring the results across multiple days (this is called an A/B test). The new design had an average of 15 clicks per user with standard deviation 7 and the old design had an average of 6 clicks per user with standard deviation of 2. Does the mean clicks per user differ between the new homepage and the old homepage? Test this hypothesis at the a = 0.05 level.

Glencoe Algebra 1, Student Edition, 9780079039897, 0079039898, 2018
18th Edition
ISBN:9780079039897
Author:Carter
Publisher:Carter
Chapter10: Statistics
Section10.6: Summarizing Categorical Data
Problem 27PPS

Related questions
Question
a. Set up the null and alternative hypothesis (using mathematical notation/numbers and interpret them in context of the problem).
b. Calculate the test statistic for the test from part a.
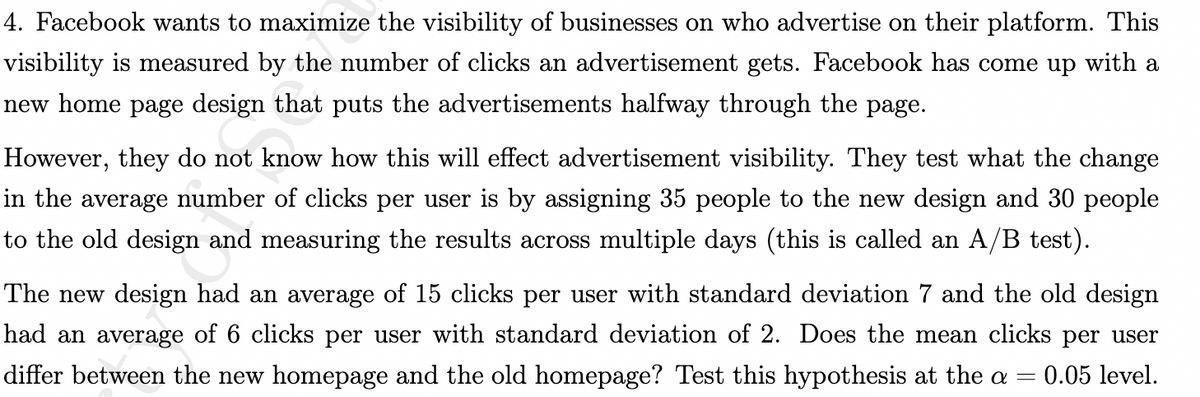
Transcribed Image Text:4. Facebook wants to maximize the visibility of businesses on who advertise on their platform. This
visibility is measured by the number of clicks an advertisement gets. Facebook has come up with a
new home page design that puts the advertisements halfway through the page.
However, they do not know how this will effect advertisement visibility. They test what the change
in the average number of clicks per user is by assigning 35 people to the new design and 30 people
to the old design and measuring the results across multiple days (this is called an A/B test).
The new design had an average of 15 clicks per user with standard deviation 7 and the old design
had an average of 6 clicks per user with standard deviation of 2. Does the mean clicks per user
differ between the new homepage and the old homepage? Test this hypothesis at the a 0.05 level.
-
Expert Solution
This question has been solved!
Explore an expertly crafted, step-by-step solution for a thorough understanding of key concepts.

This is a popular solution!

Trending now
This is a popular solution!

Step by step
Solved in 3 steps with 3 images

Recommended textbooks for you
Glencoe Algebra 1, Student Edition, 9780079039897…
Algebra
ISBN:
9780079039897
Author:
Carter
Publisher:
McGraw Hill
Glencoe Algebra 1, Student Edition, 9780079039897…
Algebra
ISBN:
9780079039897
Author:
Carter
Publisher:
McGraw Hill