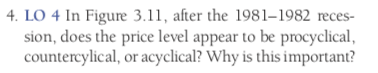
4. LO 4 In Figure 3.11, after the 1981-1982 reces- sion, does the price level appear to be procyclical, countercylical, or acyclical? Why is this important? Figure 3.11 Percentage Deviations from Trend in the Price Level (the Implicit GDP Price Defla- tor) and Real GDP A correlation is difficult to discern in the figure, but the measured correlation coefficient is-0.17. There is a reverse Phillips curve. Source: Data from U.S. Department of Commerce, Bureau of Economic Analysis, O Stephen D. Williamson. Price Level 2 GDP -6 -8 1940 2000 1950 1970 1990 2020 1960 1980 2010 Year Percentage Deviati on From Trend
4. LO 4 In Figure 3.11, after the 1981-1982 reces- sion, does the price level appear to be procyclical, countercylical, or acyclical? Why is this important? Figure 3.11 Percentage Deviations from Trend in the Price Level (the Implicit GDP Price Defla- tor) and Real GDP A correlation is difficult to discern in the figure, but the measured correlation coefficient is-0.17. There is a reverse Phillips curve. Source: Data from U.S. Department of Commerce, Bureau of Economic Analysis, O Stephen D. Williamson. Price Level 2 GDP -6 -8 1940 2000 1950 1970 1990 2020 1960 1980 2010 Year Percentage Deviati on From Trend

Chapter18: Introduction To Macroeconomics: Unemployment, Inflation, And Economic Fluctuations
Section: Chapter Questions
Problem 18P

Related questions
Question
Transcribed Image Text:4. LO 4 In Figure 3.11, after the 1981-1982 reces-
sion, does the price level appear to be procyclical,
countercylical, or acyclical? Why is this important?
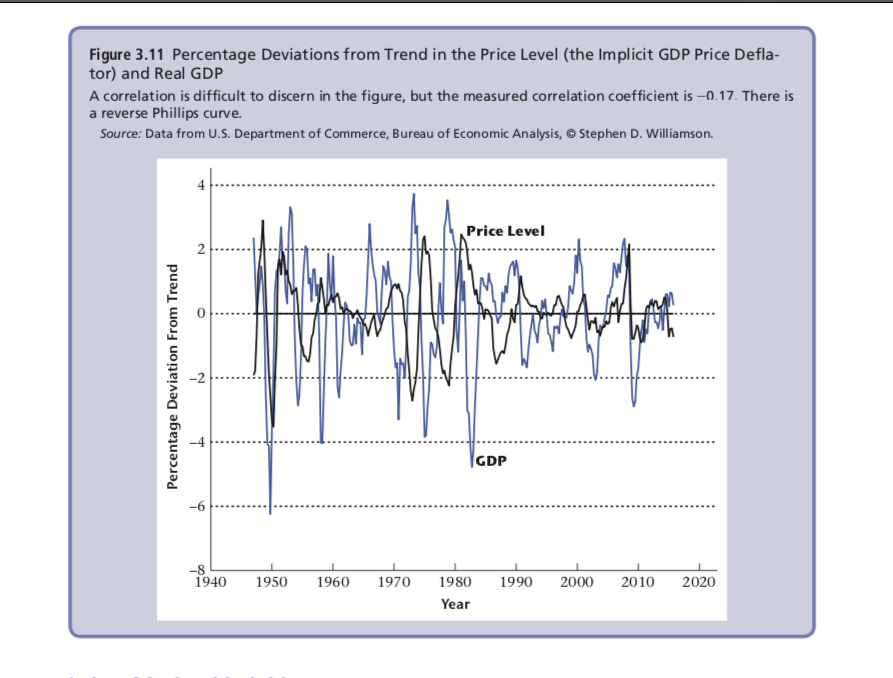
Transcribed Image Text:Figure 3.11 Percentage Deviations from Trend in the Price Level (the Implicit GDP Price Defla-
tor) and Real GDP
A correlation is difficult to discern in the figure, but the measured correlation coefficient is-0.17. There is
a reverse Phillips curve.
Source: Data from U.S. Department of Commerce, Bureau of Economic Analysis, O Stephen D. Williamson.
Price Level
2
GDP
-6
-8
1940
2000
1950
1970
1990
2020
1960
1980
2010
Year
Percentage Deviati on From Trend
Expert Solution
This question has been solved!
Explore an expertly crafted, step-by-step solution for a thorough understanding of key concepts.

This is a popular solution!

Trending now
This is a popular solution!

Step by step
Solved in 2 steps

Recommended textbooks for you
Exploring Economics
Economics
ISBN:
9781544336329
Author:
Robert L. Sexton
Publisher:
SAGE Publications, Inc

Principles of Economics (MindTap Course List)
Economics
ISBN:
9781305585126
Author:
N. Gregory Mankiw
Publisher:
Cengage Learning

Principles of Macroeconomics (MindTap Course List)
Economics
ISBN:
9781305971509
Author:
N. Gregory Mankiw
Publisher:
Cengage Learning
Exploring Economics
Economics
ISBN:
9781544336329
Author:
Robert L. Sexton
Publisher:
SAGE Publications, Inc
Principles of Economics (MindTap Course List)
Economics
ISBN:
9781305585126
Author:
N. Gregory Mankiw
Publisher:
Cengage Learning
Principles of Macroeconomics (MindTap Course List)
Economics
ISBN:
9781305971509
Author:
N. Gregory Mankiw
Publisher:
Cengage Learning

Brief Principles of Macroeconomics (MindTap Cours…
Economics
ISBN:
9781337091985
Author:
N. Gregory Mankiw
Publisher:
Cengage Learning

Essentials of Economics (MindTap Course List)
Economics
ISBN:
9781337091992
Author:
N. Gregory Mankiw
Publisher:
Cengage Learning