4. What intercept would you expect in this experiment? Explain your reasoning. в I U E = E E 8 O fx 5. Is the intercept of your graph what you expect? Explain your reasoning. BIU E E E E O fx
4. What intercept would you expect in this experiment? Explain your reasoning. в I U E = E E 8 O fx 5. Is the intercept of your graph what you expect? Explain your reasoning. BIU E E E E O fx

Related questions
Question
Pendulum experiment
Transcribed Image Text:4. What intercept would you expect in this experiment? Explain your reasoning.
в I U
= E E
fx
5. Is the intercept of your graph what you expect? Explain your reasoning.
в I U
E E E E
fx
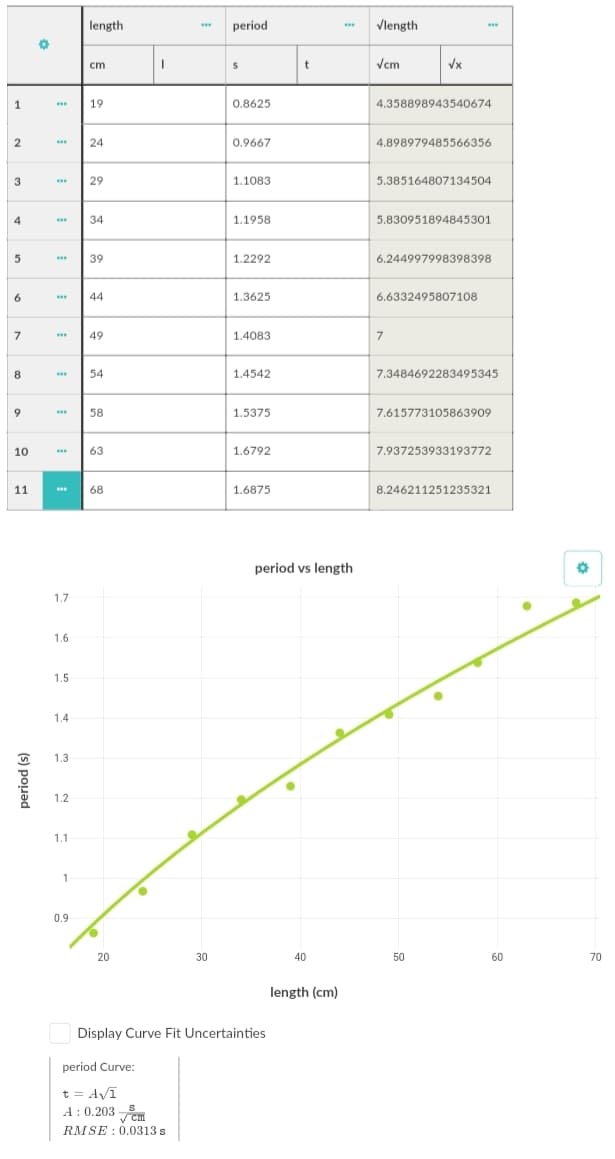
Transcribed Image Text:length
period
Vlength
cm
t
Vcm
Vx
1
19
0.8625
4.358898943540674
2
24
0.9667
4.898979485566356
3
29
1.1083
5.385164807134504
4
34
1.1958
5.830951894845301
5
39
1.2292
6.244997998398398
6
44
1.3625
6.6332495807108
49
1.4083
7
8
54
1.4542
7.3484692283495345
9
58
1.5375
7.615773105863909
10
63
1.6792
7.937253933193772
11
68
1.6875
8.246211251235321
period vs length
1.7
1.6
1.5
1.4
1.3
1.2
1.1
1
0.9
20
30
40
50
60
70
length (cm)
Display Curve Fit Uncertainties
period Curve:
t = AVI
A : 0.203
RMSE : 0.0313 s
(s) popad
Expert Solution
This question has been solved!
Explore an expertly crafted, step-by-step solution for a thorough understanding of key concepts.

This is a popular solution!

Trending now
This is a popular solution!

Step by step
Solved in 2 steps
