4. What is the forecast for the 13th period based on the four-period moving average? Round your answer to two decimal places. 5. What is the MSE for the four-period moving average? Round your answer to two decimal places. 6. Choose the correct graph for the four-period moving average forecast. The correct graph i graph A graph B graph C Three-Period Moving Average Forecas 100 graph D :- 95 90- A. 85 80 Time Period 9. 10 11 12 13 14 Three-Period Moving Average Forecast Observation Forecast 100 95 90 Back
4. What is the forecast for the 13th period based on the four-period moving average? Round your answer to two decimal places. 5. What is the MSE for the four-period moving average? Round your answer to two decimal places. 6. Choose the correct graph for the four-period moving average forecast. The correct graph i graph A graph B graph C Three-Period Moving Average Forecas 100 graph D :- 95 90- A. 85 80 Time Period 9. 10 11 12 13 14 Three-Period Moving Average Forecast Observation Forecast 100 95 90 Back

Practical Management Science
6th Edition
ISBN:9781337406659
Author:WINSTON, Wayne L.
Publisher:WINSTON, Wayne L.
Chapter2: Introduction To Spreadsheet Modeling
Section: Chapter Questions
Problem 20P: Julie James is opening a lemonade stand. She believes the fixed cost per week of running the stand...

Related questions
Question
I could use a hand with this
Transcribed Image Text:Build Your Own - Add Packagex
A New 2022 Mercedes-Benz EQ X
G bmw m240i for sale - Google
* MindTap - Cengage Learning
+
c/nb/ui/evo/index.html?elSBN=9780357131725&snapshotld=2709085&id=1357911453&
mps
Operations Manag..
ENGAGE MINDTAP
ter 09 Excel Activity: Moving Average
on 1
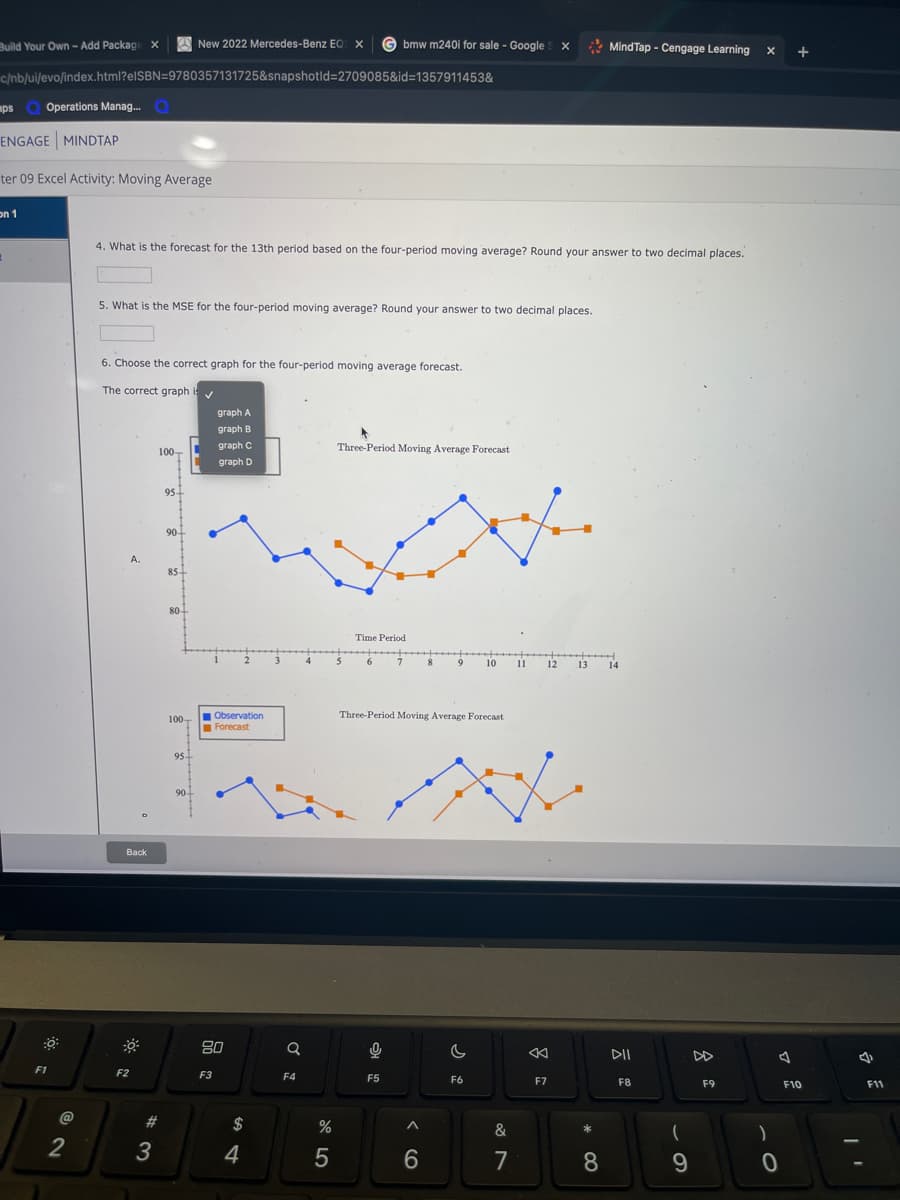
4. What is the forecast for the 13th period based on the four-period moving average? Round your answer to two decimal places.
5. What is the MSE for the four-period moving average? Round your answer to two decimal places.
6. Choose the correct graph for the four-period moving average forecast.
The correct graph i
graph A
graph B
graph C
Three-Period Moving Average Forecast
100-
graph D
:-
95
90-
A.
85
80-
Time Period
6
9
10
11
12
13
14
1 Observation
Forecast
Three-Period Moving Average Forecast
100-
95
90-
Back
80
F1
F2
F3
F4
F5
F6
F7
F8
F9
F10
F11
@
23
$
%
&
)
6.
7
8
Transcribed Image Text:H24
fx
A
D
G
I
K
L
M
N
P
R.
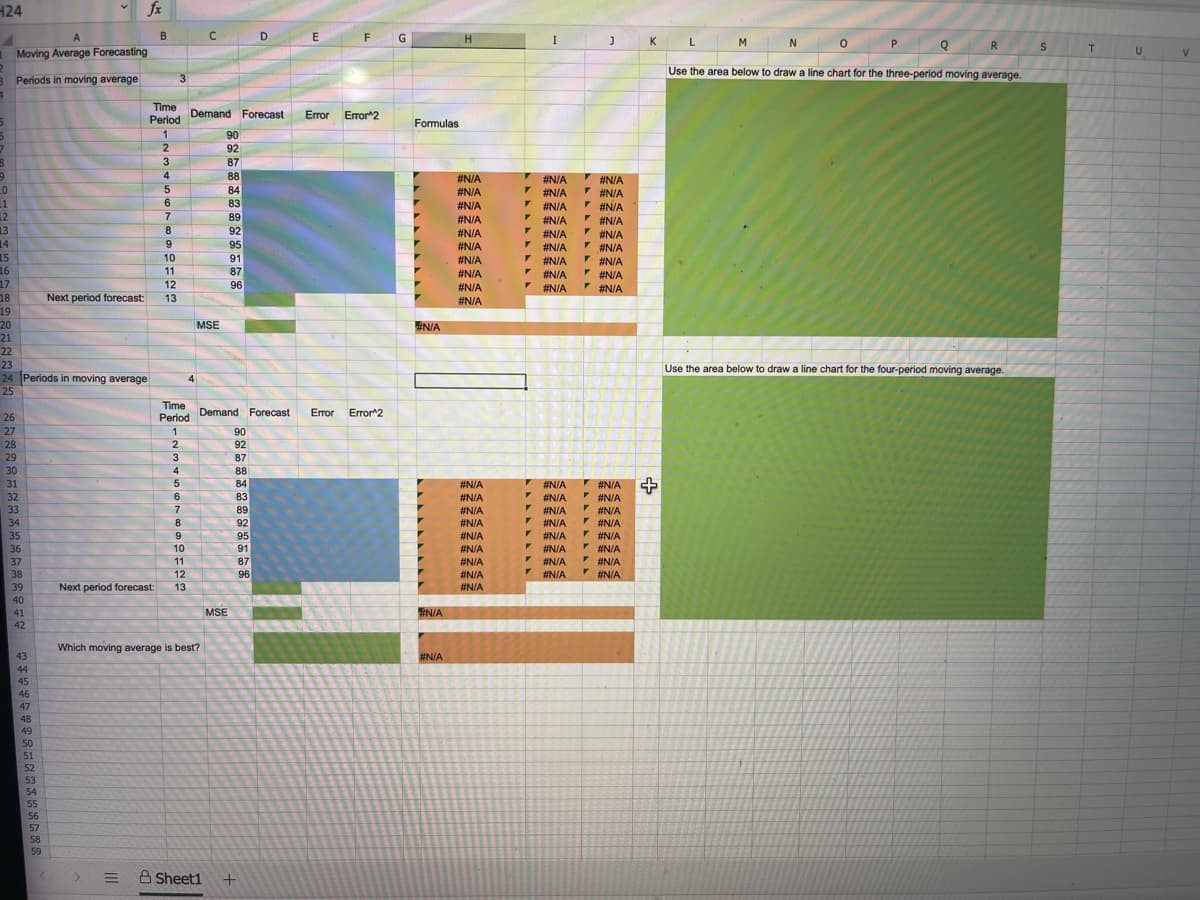
Moving Average Forecasting
U
Use the area below to draw a line chart for the three-period moving average.
Periods in moving average
Time
Period
Demand Forecast
Error Error2
Formulas
1
90
2
92
3
87
88
#N/A
#N/A
I #N/A
V #N/A
I #N/A
#N/A
84
#N/A
11
12
13
14
15
16
17
6
83
#N/A
#N/A
89
#N/A
#N/A
#N/A
V#N/A
V #N/A
* #N/A
* #N/A
* #N/A
8
92
#N/A
#N/A
9
95
#N/A
* #N/A
10
91
#N/A
#N/A
11
87
#N/A
#N/A
12
96
#N/A
#N/A
18
Next period forecast:
13
#N/A
19
20
MSE
#N/A
21
22
23
Use the area below to draw a line chart for the four-period moving average.
24 Periods in moving average
4.
25
Time
Period
Error 2
Demand Forecast
Error
26
27
1
90
92
28
29
3
87
30
4
88
V #N/A C
* #N/A
* #N/A
V #N/A
* #N/A
* #NIA
* #N/A
V
31
84
#N/A
#N/A
* #N/A
32
33
6
83
#N/A
7
89
#N/A
V #N/A
V #N/A
* #NIA
#N/A
#N/A
34
8.
92
35
95
91
#N/A
36
10
#N/A
11
87
37
38
#N/A
#N/A
12
96
#N/A
#N/A
#N/A
#N/A
39
Next period forecast:
13
40
MSE
N/A
41
42
Which moving average is best?
43
#N/A
44
45
46
47
48
49
50
51
52
53
54
55
56
57
58
59
A Sheet1
Expert Solution
This question has been solved!
Explore an expertly crafted, step-by-step solution for a thorough understanding of key concepts.

This is a popular solution!

Trending now
This is a popular solution!

Step by step
Solved in 4 steps with 6 images

Recommended textbooks for you
Practical Management Science
Operations Management
ISBN:
9781337406659
Author:
WINSTON, Wayne L.
Publisher:
Cengage,

Operations Management
Operations Management
ISBN:
9781259667473
Author:
William J Stevenson
Publisher:
McGraw-Hill Education

Operations and Supply Chain Management (Mcgraw-hi…
Operations Management
ISBN:
9781259666100
Author:
F. Robert Jacobs, Richard B Chase
Publisher:
McGraw-Hill Education
Practical Management Science
Operations Management
ISBN:
9781337406659
Author:
WINSTON, Wayne L.
Publisher:
Cengage,
Operations Management
Operations Management
ISBN:
9781259667473
Author:
William J Stevenson
Publisher:
McGraw-Hill Education
Operations and Supply Chain Management (Mcgraw-hi…
Operations Management
ISBN:
9781259666100
Author:
F. Robert Jacobs, Richard B Chase
Publisher:
McGraw-Hill Education


Purchasing and Supply Chain Management
Operations Management
ISBN:
9781285869681
Author:
Robert M. Monczka, Robert B. Handfield, Larry C. Giunipero, James L. Patterson
Publisher:
Cengage Learning

Production and Operations Analysis, Seventh Editi…
Operations Management
ISBN:
9781478623069
Author:
Steven Nahmias, Tava Lennon Olsen
Publisher:
Waveland Press, Inc.