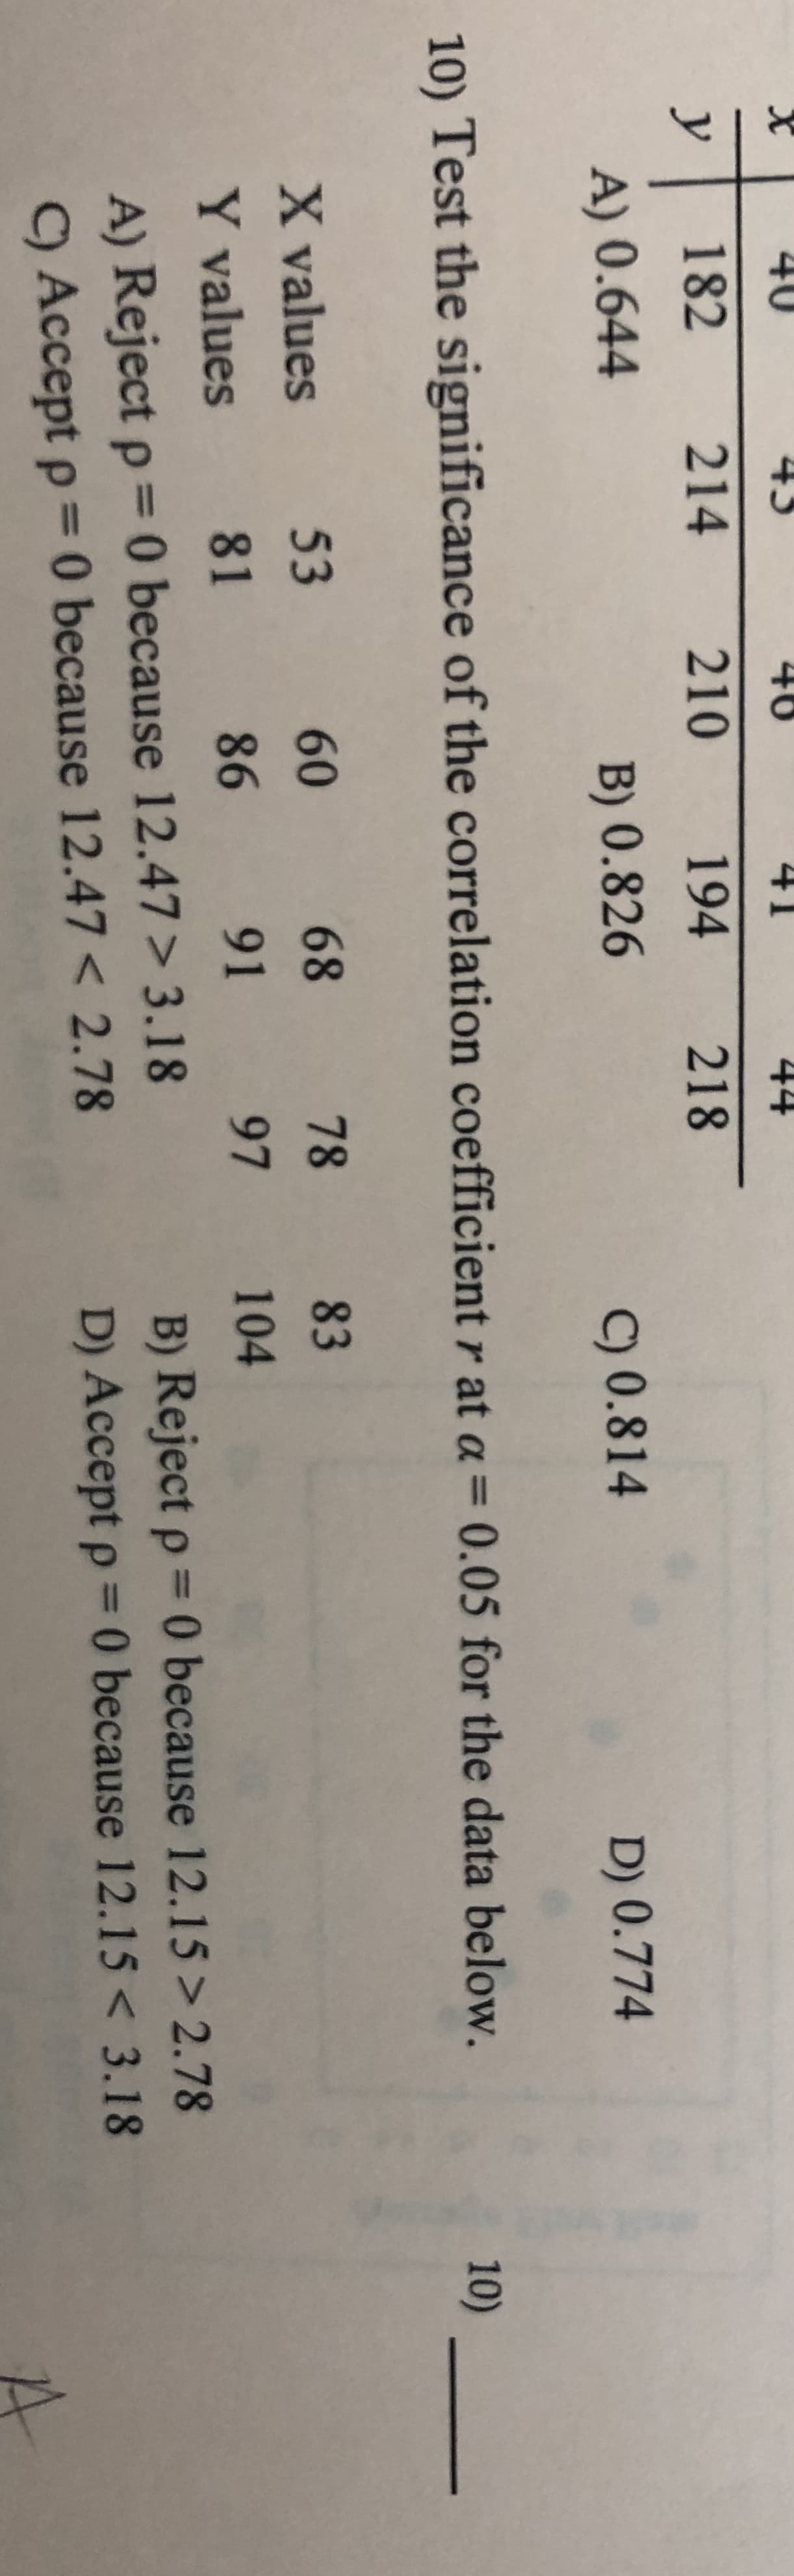
40 45 40 41 44 y 182 214 210 194 218 A) 0.644 B) 0.826 90.814 D) 0.774 10) Test the significance of the correlation coefficient r at a = 0.05 for the data below. 10) X values 53 60 68 78 83 Y values 81 86 91 97 104 A) Reject p 0 because 12.47 > 3.18 9 Accept p 0 because 12.47 < 2.78 B) Reject p D) Accept p 0 because 12.15> 2.78 0 because 12.15< 3.18


Q: The following table shows the original marks of six candidates in two examinations. Candidate A B…
A: The following data for the X and Y variables are provided to find the sample correlation…
Q: 1. A chemistry teacher conducted a 100-point pre-test at the beginning of the semester. The same…
A: Given : Student No. Pre-test score , X Post test score, Y 1 60 68 2 63 66 3 67 78 4 64 75…
Q: A student conducted a correlation analysis and obtained the following values: weight, X TSC, Y X*X…
A: Solution:- Given data: Σx=288, Σy=14.9, Σx2=17064 Σy2=51.87, Σx.y=896.5To calculate the…
Q: pose that data are obtained from 20 pairs of (x, y) and the sample correlation coefficient is 0.76.…
A:
Q: Here is a bivariate data set. x y 53.5 8.7 32.9 117.7 57.5 55.1 34 68.3 29.2 124.3 44.5 70.1 59.1…
A:
Q: Here is a bivariate data set. x y 65.4 79.9 85 115.5 84.9 45.4 77.1 76.3 85.4 51.3 68.3 56.9 94.1…
A: It is an important part of statistics . It is widely used .
Q: 3. The following sample contains values of the price and quantity sold of a particular commodity.…
A:
Q: A professor claims that students who have faster typing speed (in words per minute) tend to have…
A: Here's, correlation coefficient is 0.3234 which is too weak relationship between them. Hence option…
Q: Calculate coefficient of correlation r between the marks in statistics (X) and Accountancy (Y) of 10…
A: From the given data we make the following table to compute coefficient of correlation r between the…
Q: Here is a bivariate data set. X y 47.1 59.5 47.4 64.8 68.8 7.7 56.3 39.3 45.7 41.5 45.2 58 57.5 40.5…
A: A bivariate data set is given.
Q: Here is a bivariate data set. x y 49 83.4 46 143.3 50.8 116.6 45.5 173.3 38.6 119.2 34.1 106.8 51.7…
A: The provided data set can be tabulated as:
Q: A sociologist is interested in the relation between x = number of job changes and y = annual salary…
A: a) From the given information, x y X^2 Y^2 XY 5 36 25 1296 180 3 37 9 1369 111 6 34 36…
Q: A professor claims that students who have faster typing speed (in words per minute) tend to have…
A: Given: Sample size, n=30Sample correlation coefficient, r=0.3234
Q: rela 6. 6. Ues för Corelation Ce y 8. 10 13 19 Clic Clic 3 0.997 4 0.950 5 0.878 6 0.811 7 0.754…
A: Given : X Y 2 4 4 8 6 10 6 13 7 19
Q: Men Women 61.7 42.8 72.6 57.9 55.4 62.1 60.4 74.2 75.3 75.4 49.1 65.2
A: The given data is Men(x) Women(y) 61.7 60.4 42.8 74.2 72.6 75.3 57.9 75.4 55.4 49.1…
Q: Here is a bivariate data set. x y 52.1 29.4 74.3 -20.5 35.4 36.8 23.8 22.5 61.1 -28.6…
A: For the given data Find r = ? R² = ? %
Q: Consider the set of pairs ((x. y)} of pairs shown in the following figure, which refers to two…
A: Correlation between two variables shows three types of association between variables. They are…
Q: Suppose that data are obtained from 50 pairs of (x, y) and the sample correlation coefficient is…
A:
Q: If the Karl Pearson correlation value r is zero, then comment on r is ________. a. Strong Negative…
A: If correlation=r=0 Then there is no relationship bor no correlation.
Q: Based on the following scores of X and Y, calculate the Pearson correlation. X Y 60 6 40…
A: To find: Pearson correlation coefficient
Q: x y 1 16.45 2 17.5 3 18.05 4 19.6 5 20.45 6 22.7 7 25.05 r=
A:
Q: 1. Find the r - value for the correlation between the scores of 5 selected Grade 12 students on the…
A: given X Y 23 21 21 22 20 23 20 18 19 17 to find - correlation coefficient r by…
Q: Computer, the correlation coefficient, using the following data. x 8 3 7 6 1 4 y 10 6 10 8 2 6…
A: Correlation: It is a method that is applied between the pairs of variables to check how the…
Q: Here is a bivariate data set. x y 68.3 21.8 61.5 22.3 63.2 4.8 68.2 37.4 70.5 39.8 83.2 53.5 72.2…
A: Correlation quantifies the strength of relation between variables. The value of correlation…
Q: Here is a bivariate data set. x y 60.3 109.1 39.8 73 72.1 79.7 67.7 8 61.7 44.3 45 68.5 49 132.2…
A: Enter this data into Excel
Q: 10. Use the given information to find the coefficient of determination. Find the coefficient of…
A: Given that, Linear correlation coefficient , r = 0.519
Q: 2. Calculate the correlation coefficient between the two variables x and y shown below: X -1 1 2 4…
A: Calculate Correlation Coefficient r without cov(x,y) from the following data X Y -1 -1 1 2…
Q: A random sample of second year business students at a small Canadian university were polled by a…
A: Given that, Let X be hours of study and Y be marks received in exam. ∑X=188, ∑X^2=3832, ∑Y=793,…
Q: A random sample of second year business students at a small Canadian university were polled by a…
A: Given: A sample of second year business students at a small Canadian university were polled by a…
Q: Here is a bivariate data set. x y 74 59.4 79.1 71.1 84.5 83.7 76.6 73.1 86 70.2 75.8 66.1 82.3 66.2…
A:
Q: Given the scores in Mathematics in the Modern World and English below, rank the scores, and use the…
A: Given Data: Mathematics English 35 38 64 78 45 49 30 26 28 59 60 54 44 33 50 70…
Q: Suppose that data are obtained from 40 pairs of (x, y) and the sample correlation coefficient is…
A: Confidence interval is the range that explains where the population parameter value lines. When the…
Q: Here is a bivariate data set. x y 74.8 -4.5 75.6 50.8 59.8 59.2 81.1 10.2 74.3 99.4 101.9 -6.7 49.2…
A:
Q: A random sample of second year business students at a small Canadian university were polled by a…
A: Given that, ∑X=188, ∑X^2=3832, ∑Y=793, ∑Y^2=65,143 and ∑XY=15,540 Let X be hours studying and Y be…
Q: F39) x y 23 ; 88 76 ; 300 27 ; 105 64 ; 240 15 ; 60 51 ; 205 33 ; 120 29 ; 110 When…
A: Excel Procedure: Enter X and Y in Excel>Data>Data Analysis> ‘Regression’>Select Y under…
Q: Here is a bivariate data set. x y 19 54 20 50 46 44 19 49 30 21 -1 74 -27 85 26 70 -7 73 Find the…
A: It is an important part of statistics . It is widely used .
Q: x 19.3 23.4 10.3 17.7 23.2 y 6 2 3 3 3
A: Following values can be calculated from the gives values as follows:
Q: (a) Following hypothetical data show the number of days taken by 10 persons to recover from COVID 19…
A: Since you have asked multiple question, we will solve the first question for you. If you want any…
Q: A random sample of second year business students at a small Canadian university were polled by a…
A: In order to obtain the regression equation, first perform regression analysis on the data.…
Q: What is the 95% confidence interval (i.e., prediction interval) for exam performance of Fred who…
A: Let X be hours studying and Y be exam percentage. The least square regression equation is given as…
Q: Here is a bivariate data set. 67.2 40.9 76.7 38.2 69.8 48.5 64.9 47.9 76.2 40.6 67.3 38.7 79.7 37.3…
A: Calculate Correlation Coefficient r without cov(x,y) from the following data X Y 67.2 40.9…
Q: The data below show the Marks scored by eight IT students in two tests: Probability and…
A: GivenData of marks obtained by 8 students in Probability and Statistics and programming as shown…
Q: of two personnel evaluation techniques available, the first requires a 2-hour test-interview while…
A: Given data: Test 1 (x) Test 2 (y) 75 38 90 56 60 35 71 46 92 58 106 69 55 30 87…
Q: x y 10 8.04 8 6.95 13 7.58 9 8.81 11 8.33 14 9.96 6 7.23 4 4.26 12 10.84 6) The…
A:
Q: The following table compares the completion percentage and interception percentage of 55 NFL…
A:
Q: Listed below are numbers of Internet users per 100 people and numbers of scientific award winners…
A: Scatter plot :
Q: ) Check Image Best Actress Best Actor 28 41 30 38 30…
A: Hello! As you have posted more than 3 sub parts, we are answering the first 3 sub-parts. In case…
Q: The following data shows the death cases of COVID-19, x and the number of positive COVID-19 cases, y…
A:


Trending now
This is a popular solution!

Step by step
Solved in 5 steps with 2 images

- The following data show the number of class sessions missed during a semester of SOC221 and the final grade for a sample of 8 students selected at random. Number of Sessions Missed Final Grade (x) (y) 0 96 2 88 12 68 6 91 8…(a) Is a sample correlation coefficient ρ = 0.83 significant at the α = 0.01 level based on a sample size of n = 4 data pairs? What about n = 14 data pairs? (Select all that apply.) Yes, because the absolute value of the given correlation coefficient is greater than or equal to that for a sample size of n = 4 and α = 0.01. No, because the absolute value of the given correlation coefficient is smaller than that for a sample size of n = 14 and α = 0.01. No, because the absolute value of the given correlation coefficient is smaller than that for a sample size of n = 4 and α = 0.01. No, because the absolute value of the given correlation coefficient is greater than or equal to that for a sample size of n = 14 and α = 0.01. Yes, because the absolute value of the given correlation coefficient is greater than or equal to that for a sample size of n = 14 and α = 0.01. No, because the absolute value of the given correlation coefficient is greater than or equal to that for a sample size of n =…A sample of men and women who had passed their driver's test either the first time or the second time were surveyed, with the following results: Results of the driving testGender First time Second timeMen 126 211Women 135 178a) Do these data suggest that there is a relationship between gender and the passing of their driver’s test from which the present sample was drawn? Let alpha=.05
- Consider a regression analysis with n = 47 and three potential independent variables. Suppose that one of the independent variables has a correlation of 0.95 with the dependent variable. Does this imply that this independent variable will have a very large Student’s t statistic in the regression analysis with all three predictor variables?Suppose the random variables X and Y are inde lent and identically distributed. Let Z =aX +Y. If the correlation coefficient between X and Z is1/3 , then what is the value of the constant a ?. A study is conducted on the relationship of the number of absences (x) and the grades (y) of 15 students in BC212. Using r at 0.05 level of significance and the hypothesis that there is no significant relationship between absences and grades of the students in BC212, determine the relationship using the following data.r.05 = - 0.514Number of Absencesx Grades in BC212y122338614551219 908580758065709580807592898065
- You are testing the null hypothesis that there is no relationship between two variables, X and Y. From your sample of n=22, you determine that SSR=60 and SSE=20. d. Compute the correlation coefficient by first computing r2 and assuming that b1 is negative. (Round to four decimal places as needed.)4) A medical researcher is interested in determining if there is a relationship between adults over 50 who exercise regularly and low, moderate, and high blood pressure. A random sample of 236 adults over 50 is selected and the results are given below. Test the claim that regular exercise and low, moderate, and high blood pressure are independent. Use alpha= 0.01 Blood pressure: Reg exercise: low 35, moderate 62, high 25 No reg. Exercise: low 21, moderate 65, high 28 Compute the coefficient of correlation by using the table below showing the grades of 12 learners on 2 tests in Math (X) and Science (Y) by the use of the following: a.) Spearman’s Formula; and b.) Rank-Difference Method. Student Test X Test Y 1 73 70 2 83 84 3 89 94 4 66 72 5 73 68 6 92 90 7 80 87 8 83 92 9 73 76 10 61 66 11 63 64 12 78 76
- Even a very small effect can be significant if the sample is large enough. Suppose, for example, that a researcher obtains a correlation (computed from the raw data) of r = 0.60 for a sample of n = 10 participants. a. Is this sample sufficient to conclude that a significant correlation exists in the population? Use a two-tailed test with α = .05. In your response, be sure to specify the critical value for r. b. If the sample had n = 25 participants, is the correlation significant? Again, use a two-tailed test with α = .05. In your response, be sure to specify the critical value for r.The authors of this study report a Pearson correlation coefficient estimate of r = 0.23 with a p-value of <0.01. Interpret.Use the data corresponding to measurements of brain volume (measured in cm3 )and IQ. Based on the data, could we say that the correlation between these 2 variables is different from 0? (The question refers to the correlation on the population, ie. perform a hypothesis test with alpha=0.05) Data: IQ VOL 96 1005 89 963 87 1035 87 1027 101 1281 103 1272 103 1051 96 1079 127 1034 126 1070 101 1173 96 1079 93 1067 88 1104 94 1347 85 1439 97 1029 114 1100 113 1204 124 1160