4/27/2021 BrainPOP Date: Brain POP Climate Change Worksheet Name: Cless: Analyze It Examine the monthly average carbon dioxide (CO2) concentration recorded at Hawail's Mauna Loa Observatory. Cite details from the graph to answer the following questions. 294 DATE 1. What can you observe about CO, concentrations over the course of a year? 2. At what dates are there peaks in the graph? At what dates are there valleys? 3. What is the trend of CO, concentrations in recent years? co2 CONCENTRATION PPM)
4/27/2021 BrainPOP Date: Brain POP Climate Change Worksheet Name: Cless: Analyze It Examine the monthly average carbon dioxide (CO2) concentration recorded at Hawail's Mauna Loa Observatory. Cite details from the graph to answer the following questions. 294 DATE 1. What can you observe about CO, concentrations over the course of a year? 2. At what dates are there peaks in the graph? At what dates are there valleys? 3. What is the trend of CO, concentrations in recent years? co2 CONCENTRATION PPM)

Applications and Investigations in Earth Science (9th Edition)
9th Edition
ISBN:9780134746241
Author:Edward J. Tarbuck, Frederick K. Lutgens, Dennis G. Tasa
Publisher:Edward J. Tarbuck, Frederick K. Lutgens, Dennis G. Tasa
Chapter1: The Study Of Minerals
Section: Chapter Questions
Problem 1LR

Related questions
Question
Transcribed Image Text:4/27/2021
BrainPOP
Brain
POP Climate Change Worksheet
Date:
Name:
Class:
Analyze It
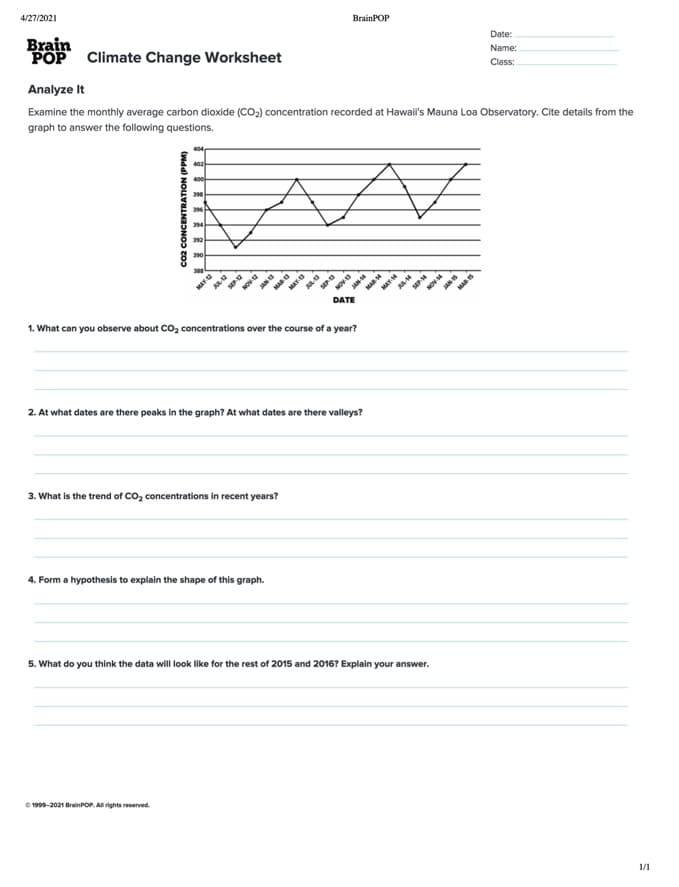
Examine the monthly average carbon dioxide (CO2) concentration recorded at Hawail's Mauna Loa Observatory. Cite details from the
graph to answer the following questions.
400
JANS
DATE
1. What can you observe about CO2 concentrations over the course of a year?
2. At what dates are there peaks in the graph? At what dates are there valleys?
3. What is the trend of CO, concentrations in recent years?
4. Form a hypothesis to explain the shape of this graph.
5. What do you think the data will look like for the rest of 2015 and 2016? Explain your answer.
© 1999-2021 BrainPOP. All rights reserved.
1/1
HAY
NOV-
JAN 1
MAD
MAY
SEP
MAR
MAY 4
SEP
NOV
MAD S
Expert Solution
This question has been solved!
Explore an expertly crafted, step-by-step solution for a thorough understanding of key concepts.

This is a popular solution!

Trending now
This is a popular solution!

Step by step
Solved in 2 steps

Recommended textbooks for you
Applications and Investigations in Earth Science …
Earth Science
ISBN:
9780134746241
Author:
Edward J. Tarbuck, Frederick K. Lutgens, Dennis G. Tasa
Publisher:
PEARSON

Exercises for Weather & Climate (9th Edition)
Earth Science
ISBN:
9780134041360
Author:
Greg Carbone
Publisher:
PEARSON

Environmental Science
Earth Science
ISBN:
9781260153125
Author:
William P Cunningham Prof., Mary Ann Cunningham Professor
Publisher:
McGraw-Hill Education
Applications and Investigations in Earth Science …
Earth Science
ISBN:
9780134746241
Author:
Edward J. Tarbuck, Frederick K. Lutgens, Dennis G. Tasa
Publisher:
PEARSON
Exercises for Weather & Climate (9th Edition)
Earth Science
ISBN:
9780134041360
Author:
Greg Carbone
Publisher:
PEARSON
Environmental Science
Earth Science
ISBN:
9781260153125
Author:
William P Cunningham Prof., Mary Ann Cunningham Professor
Publisher:
McGraw-Hill Education

Earth Science (15th Edition)
Earth Science
ISBN:
9780134543536
Author:
Edward J. Tarbuck, Frederick K. Lutgens, Dennis G. Tasa
Publisher:
PEARSON

Environmental Science (MindTap Course List)
Earth Science
ISBN:
9781337569613
Author:
G. Tyler Miller, Scott Spoolman
Publisher:
Cengage Learning

Physical Geology
Earth Science
ISBN:
9781259916823
Author:
Plummer, Charles C., CARLSON, Diane H., Hammersley, Lisa
Publisher:
Mcgraw-hill Education,