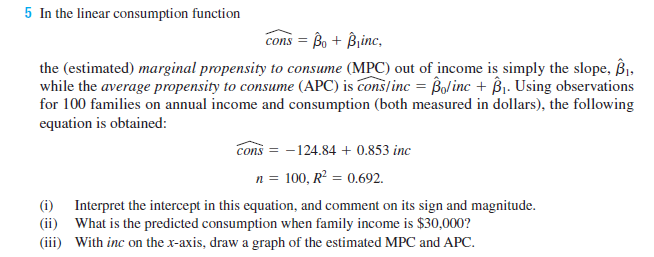
5 In the linear consumption function cons = Bo + Binc, the (estimated) marginal propensity to consume (MPC) out of income is simply the slope, B, while the average propensity to consume (APC) is cons/inc = Bolinc + ßj. Using observations for 100 families on annual income and consumption (both measured in dollars), the following equation is obtained: cons = -124.84 + 0.853 inc n = 100, R? = 0.692. (i) Interpret the intercept in this equation, and comment on its sign and magnitude. (ii) What is the predicted consumption when family income is $30,000? (iii) With inc on the x-axis, draw a graph of the estimated MPC and APC.
5 In the linear consumption function cons = Bo + Binc, the (estimated) marginal propensity to consume (MPC) out of income is simply the slope, B, while the average propensity to consume (APC) is cons/inc = Bolinc + ßj. Using observations for 100 families on annual income and consumption (both measured in dollars), the following equation is obtained: cons = -124.84 + 0.853 inc n = 100, R? = 0.692. (i) Interpret the intercept in this equation, and comment on its sign and magnitude. (ii) What is the predicted consumption when family income is $30,000? (iii) With inc on the x-axis, draw a graph of the estimated MPC and APC.

Algebra & Trigonometry with Analytic Geometry
13th Edition
ISBN:9781133382119
Author:Swokowski
Publisher:Swokowski
Chapter7: Analytic Trigonometry
Section7.6: The Inverse Trigonometric Functions
Problem 93E

Related questions
Question
Practice Pack
Transcribed Image Text:5 In the linear consumption function
cons = Bo + Binc,
the (estimated) marginal propensity to consume (MPC) out of income is simply the slope, B,
while the average propensity to consume (APC) is cons/inc = Bolinc + ßj. Using observations
for 100 families on annual income and consumption (both measured in dollars), the following
equation is obtained:
cons = -124.84 + 0.853 inc
n = 100, R? = 0.692.
(i) Interpret the intercept in this equation, and comment on its sign and magnitude.
(ii) What is the predicted consumption when family income is $30,000?
(iii) With inc on the x-axis, draw a graph of the estimated MPC and APC.
Expert Solution
This question has been solved!
Explore an expertly crafted, step-by-step solution for a thorough understanding of key concepts.

This is a popular solution!

Includes step-by-step video

Trending now
This is a popular solution!

Learn your way
Includes step-by-step video

Step by step
Solved in 3 steps with 5 images

Recommended textbooks for you
Algebra & Trigonometry with Analytic Geometry
Algebra
ISBN:
9781133382119
Author:
Swokowski
Publisher:
Cengage
Algebra & Trigonometry with Analytic Geometry
Algebra
ISBN:
9781133382119
Author:
Swokowski
Publisher:
Cengage