5. Costs in the short run versus in the long run Scooter's Scooters is a large American manufacturer of electric scooters operating out of Fort Collins. Currently, the company produces all of its scooters using a single manufacturing facility, its factory in town. Recently, management has been considering expanding operations to one or two additional factories. The following table presents the manufacturer's monthly short-run average total cost (SRATC) for various levels of production if it operates out of one, two, or three factories. (Note: Q equals the total quantity of scooters produced by all factories.) Number of Factories Q = 50 Q = 100 140 60 230 110 320 160 AVERAGE TOTAL COST (Dollars per scooter) 400 Suppose Scooter's Scooters is currently producing 300 scooters per month in its only factory. Its short-run average total cost is 360 320 Suppose Scooter's Scooters is expecting to produce 300 scooters per month for several years. In this case, in the long run, it would choose to produce scooters using 280 On the following graph, plot the three SRATC curves for Scooter's Scooters from the previous table. Specifically, use the green points (triangle symbol) to plot its SRATC curve if it operates one factory (SRATC); use the purple points (diamond symbol) to plot its SRATC curve if it operates two factories (SRATC₂); and use the orange points (square symbol) to plot its SRATC curve if it operates three factories (SRATC₂). Finally, plot the long-run average total cost (LRATC) curve for Scooter's Scooters using the blue points (circle symbol). Note: Plot your points in the order in which you would like them connected. Line segments will connect the points automatically. 240 200 160 120 80 1 2 3 40 0 0 Average Total Cost (Dollars per scooter) Q 150 Q=200 80 40 40 50 40 40 80 100 150 200 QUANTITY (Scooters) Q = 250 160 110 60 250 300 350 4 SRATC, Q=300 320 230 140 SRATC₂ SRATC per scooter. LRATC In the following table, indicate whether the long-run average cost curve exhibits economies of scale, constant returns to scale, or diseconomies of scale for each range of scooter production
5. Costs in the short run versus in the long run Scooter's Scooters is a large American manufacturer of electric scooters operating out of Fort Collins. Currently, the company produces all of its scooters using a single manufacturing facility, its factory in town. Recently, management has been considering expanding operations to one or two additional factories. The following table presents the manufacturer's monthly short-run average total cost (SRATC) for various levels of production if it operates out of one, two, or three factories. (Note: Q equals the total quantity of scooters produced by all factories.) Number of Factories Q = 50 Q = 100 140 60 230 110 320 160 AVERAGE TOTAL COST (Dollars per scooter) 400 Suppose Scooter's Scooters is currently producing 300 scooters per month in its only factory. Its short-run average total cost is 360 320 Suppose Scooter's Scooters is expecting to produce 300 scooters per month for several years. In this case, in the long run, it would choose to produce scooters using 280 On the following graph, plot the three SRATC curves for Scooter's Scooters from the previous table. Specifically, use the green points (triangle symbol) to plot its SRATC curve if it operates one factory (SRATC); use the purple points (diamond symbol) to plot its SRATC curve if it operates two factories (SRATC₂); and use the orange points (square symbol) to plot its SRATC curve if it operates three factories (SRATC₂). Finally, plot the long-run average total cost (LRATC) curve for Scooter's Scooters using the blue points (circle symbol). Note: Plot your points in the order in which you would like them connected. Line segments will connect the points automatically. 240 200 160 120 80 1 2 3 40 0 0 Average Total Cost (Dollars per scooter) Q 150 Q=200 80 40 40 50 40 40 80 100 150 200 QUANTITY (Scooters) Q = 250 160 110 60 250 300 350 4 SRATC, Q=300 320 230 140 SRATC₂ SRATC per scooter. LRATC In the following table, indicate whether the long-run average cost curve exhibits economies of scale, constant returns to scale, or diseconomies of scale for each range of scooter production

Principles of Microeconomics
7th Edition
ISBN:9781305156050
Author:N. Gregory Mankiw
Publisher:N. Gregory Mankiw
Chapter13: The Cost Of Production
Section: Chapter Questions
Problem 6PA

Related questions
Question
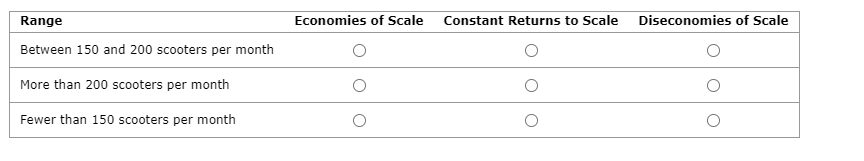
Transcribed Image Text:Range
Between 150 and 200 scooters per month
More than 200 scooters per month
Fewer than 150 scooters per month
Economies of Scale Constant Returns to Scale Diseconomies of Scale
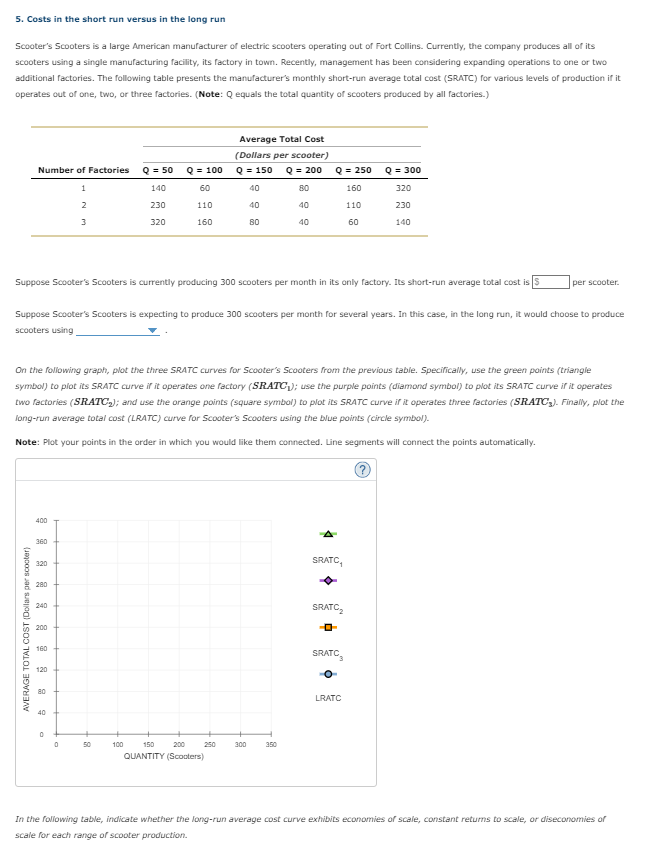
Transcribed Image Text:5. Costs in the short run versus in the long run
Scooter's Scooters is a large American manufacturer of electric scooters operating out of Fort Collins. Currently, the company produces all of its
scooters using a single manufacturing facility, its factory in town. Recently, management has been considering expanding operations to one or two
additional factories. The following table presents the manufacturer's monthly short-run average total cost (SRATC) for various levels of production if it
operates out of one, two, or three factories. (Note: Q equals the total quantity of scooters produced by all factories.)
Number of Factories Q = 50
140
230
320
AVERAGE TOTAL COST (Dollars per scooter)
400
360
320
Suppose Scooter's Scooters is currently producing 300 scooters per month in its only factory. Its short-run average total cost is S
280
240
Suppose Scooter's Scooters is expecting to produce 300 scooters per month for several years. In this case, in the long run, it would choose to produce
scooters using
200
On the following graph, plot the three SRATC curves for Scooter's Scooters from the previous table. Specifically, use the green points (triangle
symbol) to plot its SRATC curve if it operates one factory (SRATC₁); use the purple points (diamond symbol) to plot its SRATC curve if it operates
two factories (SRATC₂); and use the orange points (square symbol) to plot its SRATC curve if it operates three factories (SRATC₂). Finally, plot the
long-run average total cost (LRATC) curve for Scooter's Scooters using the blue points (circle symbol).
Note: Plot your points in the order in which you would like them connected. Line segments will connect the points automatically.
160
120
80
2
3
40
0
0
Q = 100
60
110
160
50
Average Total Cost
(Dollars per scooter)
Q = 150 Q = 200
100
150
200
QUANTITY (Scooters)
40
40
80
250
80
40
40
300
Q = 250 Q = 300
320
230
140
350
160
110
60
SRATC,
SRATC₂
-0-
SRATC
per scooter.
LRATC
In the following table, indicate whether the long-run average cost curve exhibits economies of scale, constant returns to scale, or diseconomies of
scale for each range of scooter production.
Expert Solution
This question has been solved!
Explore an expertly crafted, step-by-step solution for a thorough understanding of key concepts.

This is a popular solution!

Trending now
This is a popular solution!

Step by step
Solved in 4 steps with 1 images

Follow-up Questions
Read through expert solutions to related follow-up questions below.
Knowledge Booster


Learn more about
Need a deep-dive on the concept behind this application? Look no further. Learn more about this topic, economics and related others by exploring similar questions and additional content below.Recommended textbooks for you
Principles of Microeconomics
Economics
ISBN:
9781305156050
Author:
N. Gregory Mankiw
Publisher:
Cengage Learning

Essentials of Economics (MindTap Course List)
Economics
ISBN:
9781337091992
Author:
N. Gregory Mankiw
Publisher:
Cengage Learning

Principles of Economics 2e
Economics
ISBN:
9781947172364
Author:
Steven A. Greenlaw; David Shapiro
Publisher:
OpenStax
Principles of Microeconomics
Economics
ISBN:
9781305156050
Author:
N. Gregory Mankiw
Publisher:
Cengage Learning
Essentials of Economics (MindTap Course List)
Economics
ISBN:
9781337091992
Author:
N. Gregory Mankiw
Publisher:
Cengage Learning
Principles of Economics 2e
Economics
ISBN:
9781947172364
Author:
Steven A. Greenlaw; David Shapiro
Publisher:
OpenStax

Principles of Microeconomics (MindTap Course List)
Economics
ISBN:
9781305971493
Author:
N. Gregory Mankiw
Publisher:
Cengage Learning
