5. Draw a Production Possibilities Graph for Toyota using the following information: A В C D E F G Trucks 20 28 35 40 43 45 Cars 54 52 49 43 35 25 Plot the combination with 30 cars and 40 trucks and label it "Y." Plot the combination with 40 cars and 50 trucks and label it “X." Explain what is happening at these points.
5. Draw a Production Possibilities Graph for Toyota using the following information: A В C D E F G Trucks 20 28 35 40 43 45 Cars 54 52 49 43 35 25 Plot the combination with 30 cars and 40 trucks and label it "Y." Plot the combination with 40 cars and 50 trucks and label it “X." Explain what is happening at these points.

Principles of Economics 2e
2nd Edition
ISBN:9781947172364
Author:Steven A. Greenlaw; David Shapiro
Publisher:Steven A. Greenlaw; David Shapiro
Chapter2: Choice In A World Of Scarcity
Section: Chapter Questions
Problem 12RQ: Why is a production possibilities frontier typically drawn as a curve, rather than a straight line?

Related questions
Question
Transcribed Image Text:5.
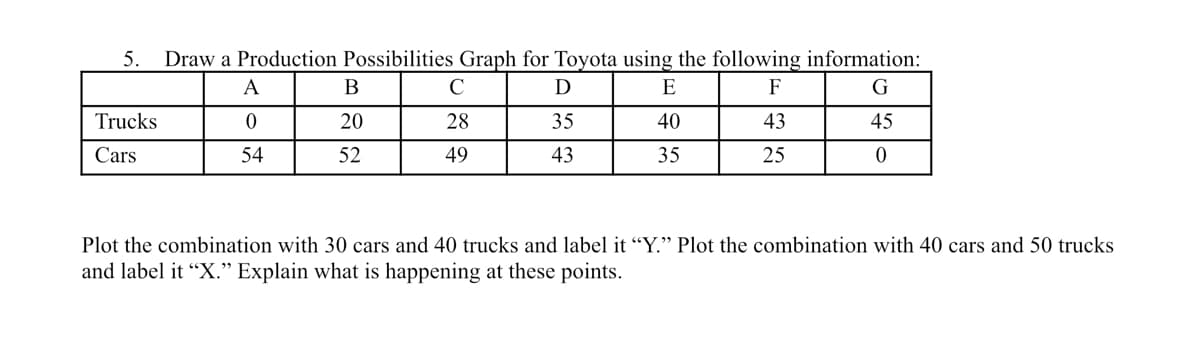
Draw a Production Possibilities Graph for Toyota using the following information:
A
В
C
D
E
F
G
Trucks
20
28
35
40
43
45
Cars
54
52
49
43
35
25
Plot the combination with 30 cars and 40 trucks and label it “Y." Plot the combination with 40 cars and 50 trucks
and label it "X." Explain what is happening at these points.
Expert Solution
This question has been solved!
Explore an expertly crafted, step-by-step solution for a thorough understanding of key concepts.

This is a popular solution!

Trending now
This is a popular solution!

Step by step
Solved in 2 steps with 1 images

Knowledge Booster


Learn more about
Need a deep-dive on the concept behind this application? Look no further. Learn more about this topic, economics and related others by exploring similar questions and additional content below.Recommended textbooks for you
Principles of Economics 2e
Economics
ISBN:
9781947172364
Author:
Steven A. Greenlaw; David Shapiro
Publisher:
OpenStax


Principles of Economics 2e
Economics
ISBN:
9781947172364
Author:
Steven A. Greenlaw; David Shapiro
Publisher:
OpenStax


Essentials of Economics (MindTap Course List)
Economics
ISBN:
9781337091992
Author:
N. Gregory Mankiw
Publisher:
Cengage Learning