5. The market for loanable funds and government policy The following graph shows the market for loanable funds. For each of the given scenarios, adjust the appropriate curve on the graph to help you complete the questions that follow. Treat each scenario separately by resetting the graph to its original state before examining the effect of each individual scenario. (Note: You will not be graded on any changes you make to the graph.) Demand Supply Supply Demand LOANABLE FUNDS (Billions of dollars) Scenario 1: Suppose savers either buy bonds or make deposits in savings accounts at banks. Initially, the interest income earned on bonds or deposits is taxed at a rate of 20%. Now suppose there is a decrease in the tax rate on interest income, from 20% to 15%. INTEREST RATE (Percent) 2) Scenario 1: Suppose savers either buy bonds or make deposits in savings accounts at banks. Initially, the interest income earned on bonds or deposits is taxed at a rate of 20%. Now suppose there is a decrease in the tax rate on interest income, from 20% to 15%. Shift the appropriate curve on the graph to reflect this change. This change in the tax treatment of saving causes the equilibrium interest rate in the market for loanable funds to and the level of investment spending to Scenario 2: An investment tax credit effectively lowers the tax bill of any firm that purchases new capital in the relevant time period. Suppose the government repeals a previously existing investment tax credit. Shift the appropriate curve on the graph to reflect this change. The repeal of the previously existing tax credit causes the interest rate to and the level of investment to Scenario 3: Initially, the government's budget is balanced; then the government responds to the conclusion of a war by significantly reducing defense spending without changing taxes. national saving. This change in spending causes the government to run a budget which Shift the appropriate curve on the graph to reflect this change. the level of investment spending. This causes the interest rate to
5. The market for loanable funds and government policy The following graph shows the market for loanable funds. For each of the given scenarios, adjust the appropriate curve on the graph to help you complete the questions that follow. Treat each scenario separately by resetting the graph to its original state before examining the effect of each individual scenario. (Note: You will not be graded on any changes you make to the graph.) Demand Supply Supply Demand LOANABLE FUNDS (Billions of dollars) Scenario 1: Suppose savers either buy bonds or make deposits in savings accounts at banks. Initially, the interest income earned on bonds or deposits is taxed at a rate of 20%. Now suppose there is a decrease in the tax rate on interest income, from 20% to 15%. INTEREST RATE (Percent) 2) Scenario 1: Suppose savers either buy bonds or make deposits in savings accounts at banks. Initially, the interest income earned on bonds or deposits is taxed at a rate of 20%. Now suppose there is a decrease in the tax rate on interest income, from 20% to 15%. Shift the appropriate curve on the graph to reflect this change. This change in the tax treatment of saving causes the equilibrium interest rate in the market for loanable funds to and the level of investment spending to Scenario 2: An investment tax credit effectively lowers the tax bill of any firm that purchases new capital in the relevant time period. Suppose the government repeals a previously existing investment tax credit. Shift the appropriate curve on the graph to reflect this change. The repeal of the previously existing tax credit causes the interest rate to and the level of investment to Scenario 3: Initially, the government's budget is balanced; then the government responds to the conclusion of a war by significantly reducing defense spending without changing taxes. national saving. This change in spending causes the government to run a budget which Shift the appropriate curve on the graph to reflect this change. the level of investment spending. This causes the interest rate to

Chapter21: Financial Markets, Saving, And Investment
Section: Chapter Questions
Problem 9P

Related questions
Question
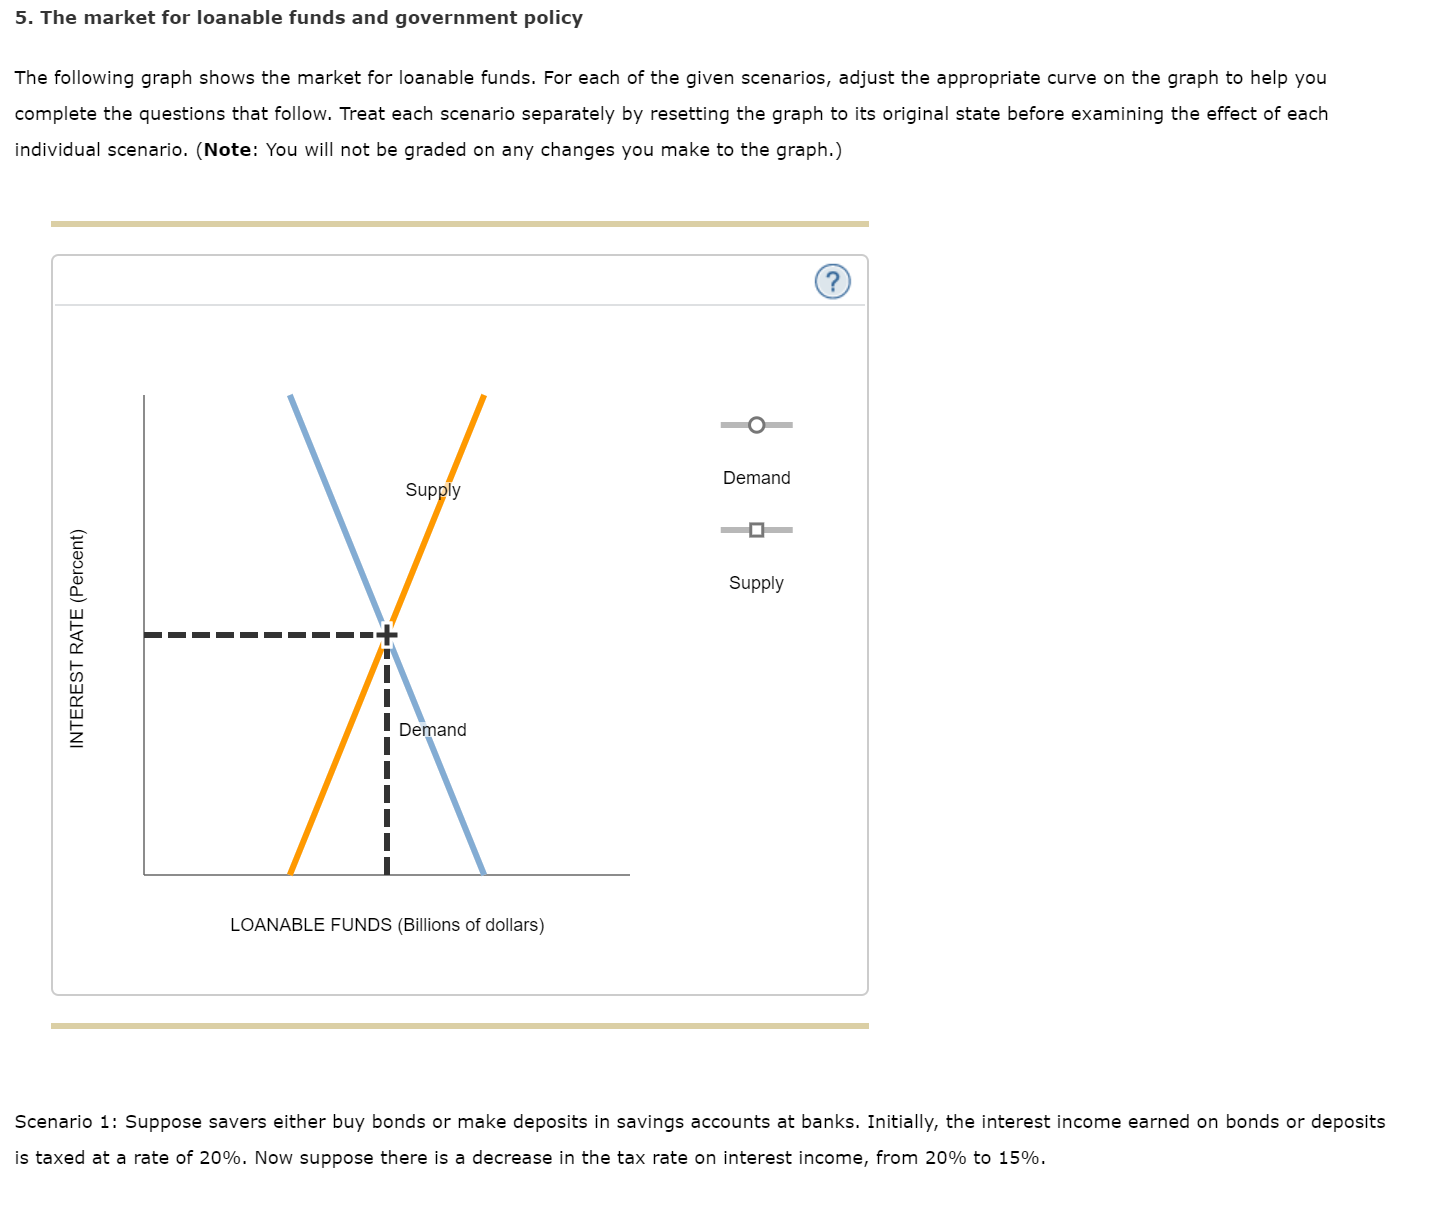
Transcribed Image Text:5. The market for loanable funds and government policy
The following graph shows the market for loanable funds. For each of the given scenarios, adjust the appropriate curve on the graph to help you
complete the questions that follow. Treat each scenario separately by resetting the graph to its original state before examining the effect of each
individual scenario. (Note: You will not be graded on any changes you make to the graph.)
Demand
Supply
Supply
Demand
LOANABLE FUNDS (Billions of dollars)
Scenario 1: Suppose savers either buy bonds or make deposits in savings accounts at banks. Initially, the interest income earned on bonds or deposits
is taxed at a rate of 20%. Now suppose there is a decrease in the tax rate on interest income, from 20% to 15%.
INTEREST RATE (Percent)
2)
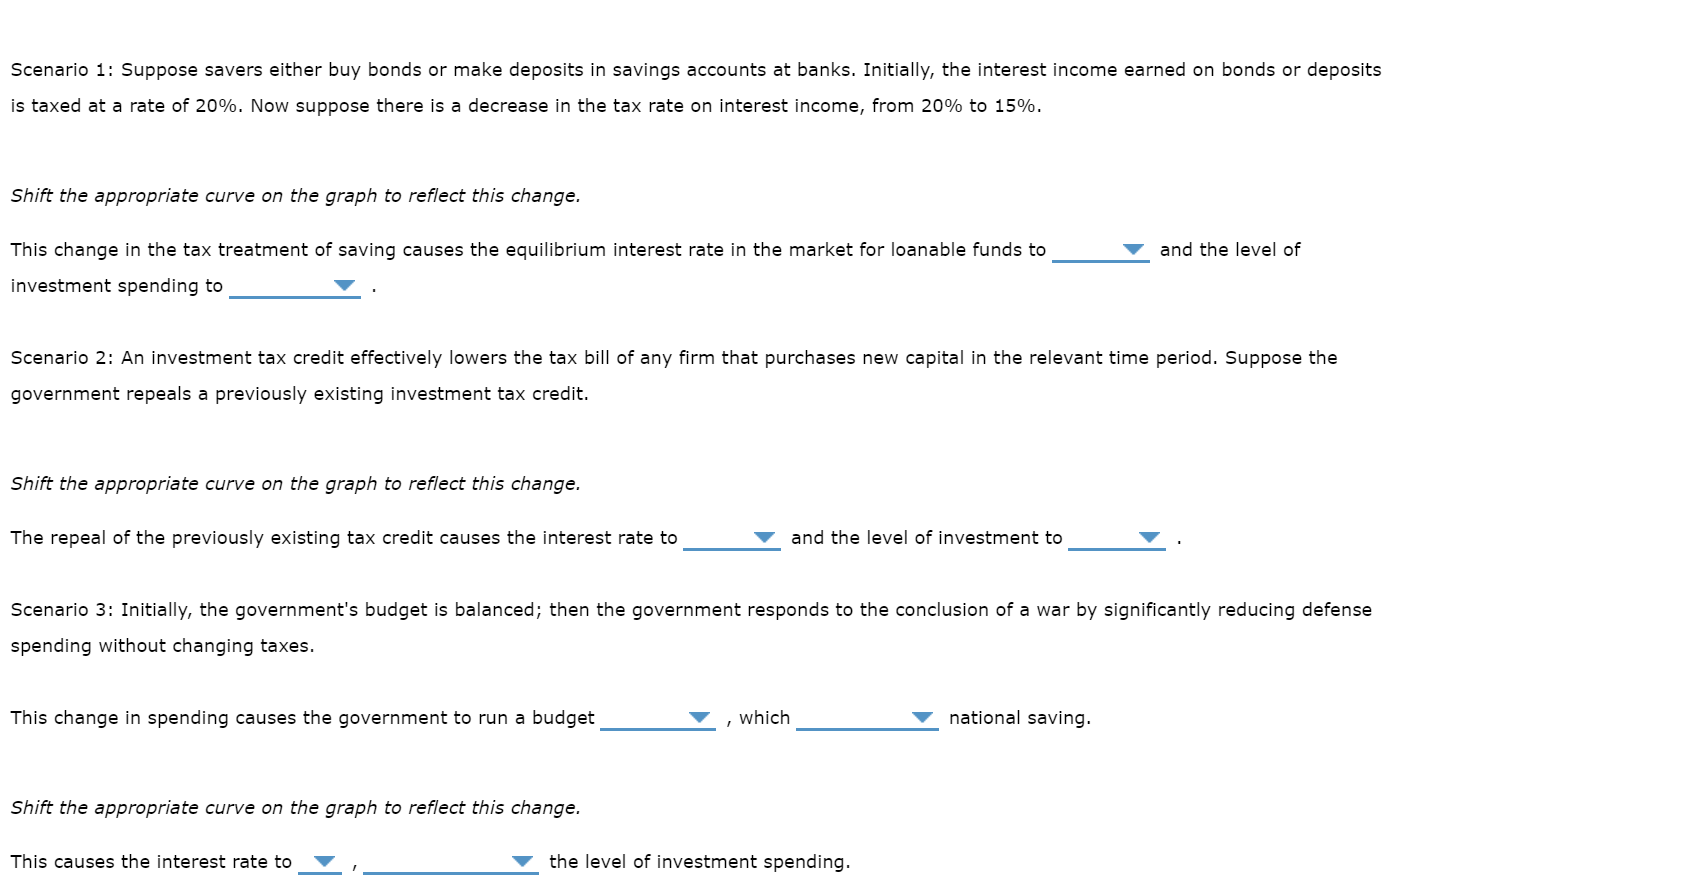
Transcribed Image Text:Scenario 1: Suppose savers either buy bonds or make deposits in savings accounts at banks. Initially, the interest income earned on bonds or deposits
is taxed at a rate of 20%. Now suppose there is a decrease in the tax rate on interest income, from 20% to 15%.
Shift the appropriate curve on the graph to reflect this change.
This change in the tax treatment of saving causes the equilibrium interest rate in the market for loanable funds to
and the level of
investment spending to
Scenario 2: An investment tax credit effectively lowers the tax bill of any firm that purchases new capital in the relevant time period. Suppose the
government repeals a previously existing investment tax credit.
Shift the appropriate curve on the graph to reflect this change.
The repeal of the previously existing tax credit causes the interest rate to
and the level of investment to
Scenario 3: Initially, the government's budget is balanced; then the government responds to the conclusion of a war by significantly reducing defense
spending without changing taxes.
national saving.
This change in spending causes the government to run a budget
which
Shift the appropriate curve on the graph to reflect this change.
the level of investment spending.
This causes the interest rate to
Expert Solution
This question has been solved!
Explore an expertly crafted, step-by-step solution for a thorough understanding of key concepts.

This is a popular solution!

Trending now
This is a popular solution!

Step by step
Solved in 6 steps with 6 images

Recommended textbooks for you
Exploring Economics
Economics
ISBN:
9781544336329
Author:
Robert L. Sexton
Publisher:
SAGE Publications, Inc

Principles of Economics, 7th Edition (MindTap Cou…
Economics
ISBN:
9781285165875
Author:
N. Gregory Mankiw
Publisher:
Cengage Learning

Essentials of Economics (MindTap Course List)
Economics
ISBN:
9781337091992
Author:
N. Gregory Mankiw
Publisher:
Cengage Learning
Exploring Economics
Economics
ISBN:
9781544336329
Author:
Robert L. Sexton
Publisher:
SAGE Publications, Inc
Principles of Economics, 7th Edition (MindTap Cou…
Economics
ISBN:
9781285165875
Author:
N. Gregory Mankiw
Publisher:
Cengage Learning
Essentials of Economics (MindTap Course List)
Economics
ISBN:
9781337091992
Author:
N. Gregory Mankiw
Publisher:
Cengage Learning

Brief Principles of Macroeconomics (MindTap Cours…
Economics
ISBN:
9781337091985
Author:
N. Gregory Mankiw
Publisher:
Cengage Learning

Principles of Economics (MindTap Course List)
Economics
ISBN:
9781305585126
Author:
N. Gregory Mankiw
Publisher:
Cengage Learning

Principles of Macroeconomics (MindTap Course List)
Economics
ISBN:
9781305971509
Author:
N. Gregory Mankiw
Publisher:
Cengage Learning