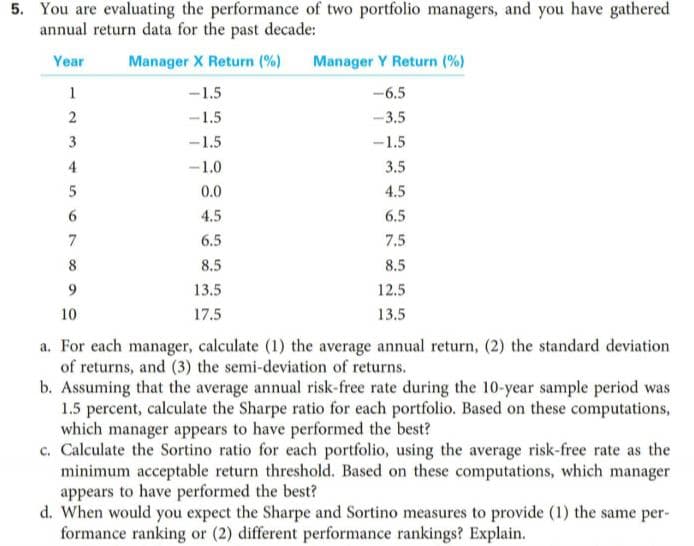
5. You are evaluating the performance of two portfolio managers, and you have gathered annual return data for the past decade: Manager X Return (%) Manager Y Return (%) Year -6.5 -1.5 -1.5 -3.5 -1.5 3 -1.5 4 -1.0 3.5 0.0 4.5 4.5 6.5 6.5 7.5 8.5 8.5 13.5 12.5 10 17.5 13.5 a. For each manager, calculate (1) the average annual return, (2) the standard deviation of returns, and (3) the semi-deviation of returns. b. Assuming that the average annual risk-free rate during the 10-year sample period was 1.5 percent, calculate the Sharpe ratio for each portfolio. Based on these computations, which manager appears to have performed the best? c. Calculate the Sortino ratio for each portfolio, using the average risk-free rate as the minimum acceptable return threshold. Based on these computations, which manager appears to have performed the best? d. When would you expect the Sharpe and Sortino measures to provide (1) the same per- formance ranking or (2) different performance rankings? Explain.
5. You are evaluating the performance of two portfolio managers, and you have gathered annual return data for the past decade: Manager X Return (%) Manager Y Return (%) Year -6.5 -1.5 -1.5 -3.5 -1.5 3 -1.5 4 -1.0 3.5 0.0 4.5 4.5 6.5 6.5 7.5 8.5 8.5 13.5 12.5 10 17.5 13.5 a. For each manager, calculate (1) the average annual return, (2) the standard deviation of returns, and (3) the semi-deviation of returns. b. Assuming that the average annual risk-free rate during the 10-year sample period was 1.5 percent, calculate the Sharpe ratio for each portfolio. Based on these computations, which manager appears to have performed the best? c. Calculate the Sortino ratio for each portfolio, using the average risk-free rate as the minimum acceptable return threshold. Based on these computations, which manager appears to have performed the best? d. When would you expect the Sharpe and Sortino measures to provide (1) the same per- formance ranking or (2) different performance rankings? Explain.

Essentials of Business Analytics (MindTap Course List)
2nd Edition
ISBN:9781305627734
Author:Jeffrey D. Camm, James J. Cochran, Michael J. Fry, Jeffrey W. Ohlmann, David R. Anderson
Publisher:Jeffrey D. Camm, James J. Cochran, Michael J. Fry, Jeffrey W. Ohlmann, David R. Anderson
Chapter15: Decision Analysis
Section: Chapter Questions
Problem 4P: Investment advisors estimated the stock market returns for four market segments: computers,...

Related questions
Question
Transcribed Image Text:5. You are evaluating the performance of two portfolio managers, and you have gathered
annual return data for the past decade:
Manager X Return (%)
Manager Y Return (%)
Year
-6.5
-1.5
-1.5
-3.5
-1.5
3
-1.5
4
-1.0
3.5
0.0
4.5
4.5
6.5
6.5
7.5
8.5
8.5
13.5
12.5
10
17.5
13.5
a. For each manager, calculate (1) the average annual return, (2) the standard deviation
of returns, and (3) the semi-deviation of returns.
b. Assuming that the average annual risk-free rate during the 10-year sample period was
1.5 percent, calculate the Sharpe ratio for each portfolio. Based on these computations,
which manager appears to have performed the best?
c. Calculate the Sortino ratio for each portfolio, using the average risk-free rate as the
minimum acceptable return threshold. Based on these computations, which manager
appears to have performed the best?
d. When would you expect the Sharpe and Sortino measures to provide (1) the same per-
formance ranking or (2) different performance rankings? Explain.
Expert Solution


Trending now
This is a popular solution!

Step by step
Solved in 9 steps with 7 images

Recommended textbooks for you
Essentials of Business Analytics (MindTap Course …
Statistics
ISBN:
9781305627734
Author:
Jeffrey D. Camm, James J. Cochran, Michael J. Fry, Jeffrey W. Ohlmann, David R. Anderson
Publisher:
Cengage Learning

Intermediate Financial Management (MindTap Course…
Finance
ISBN:
9781337395083
Author:
Eugene F. Brigham, Phillip R. Daves
Publisher:
Cengage Learning
Essentials of Business Analytics (MindTap Course …
Statistics
ISBN:
9781305627734
Author:
Jeffrey D. Camm, James J. Cochran, Michael J. Fry, Jeffrey W. Ohlmann, David R. Anderson
Publisher:
Cengage Learning
Intermediate Financial Management (MindTap Course…
Finance
ISBN:
9781337395083
Author:
Eugene F. Brigham, Phillip R. Daves
Publisher:
Cengage Learning