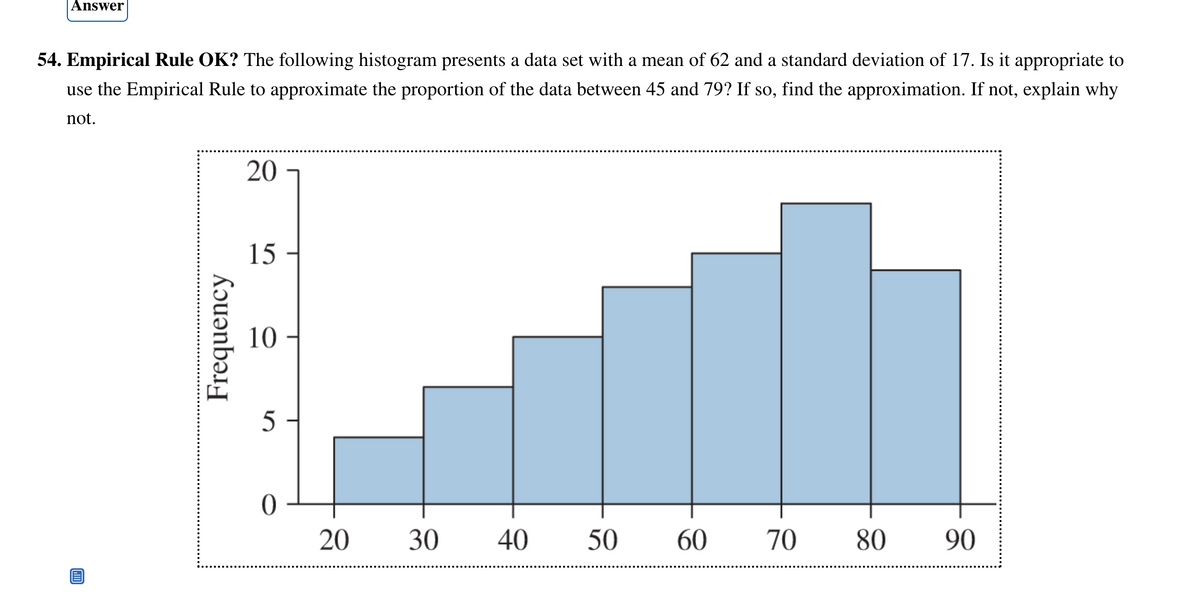
54. Empirical Rule OK? The following histogram presents a data set with a mean of 62 and a standard deviation of 17. Is it appropriate to use the Empirical Rule to approximate the proportion of the data between 45 and 79? If so, find the approximation. If not, explain why not. Frequency 20 15 0 5 20 30 40 50 60 70 80 90
54. Empirical Rule OK? The following histogram presents a data set with a mean of 62 and a standard deviation of 17. Is it appropriate to use the Empirical Rule to approximate the proportion of the data between 45 and 79? If so, find the approximation. If not, explain why not. Frequency 20 15 0 5 20 30 40 50 60 70 80 90

Glencoe Algebra 1, Student Edition, 9780079039897, 0079039898, 2018
18th Edition
ISBN:9780079039897
Author:Carter
Publisher:Carter
Chapter10: Statistics
Section10.3: Measures Of Spread
Problem 26PFA

Related questions
Question
is there a shortcut to this problem?
Transcribed Image Text:Answer
54. Empirical Rule OK? The following histogram presents a data set with a mean of 62 and a standard deviation of 17. Is it appropriate to
use the Empirical Rule to approximate the proportion of the data between 45 and 79? If so, find the approximation. If not, explain why
not.
Frequency
20
15
10
5
0
20
30 40
50
60 70
80
90
Expert Solution
This question has been solved!
Explore an expertly crafted, step-by-step solution for a thorough understanding of key concepts.

This is a popular solution!

Trending now
This is a popular solution!

Step by step
Solved in 3 steps with 3 images

Recommended textbooks for you
Glencoe Algebra 1, Student Edition, 9780079039897…
Algebra
ISBN:
9780079039897
Author:
Carter
Publisher:
McGraw Hill
Glencoe Algebra 1, Student Edition, 9780079039897…
Algebra
ISBN:
9780079039897
Author:
Carter
Publisher:
McGraw Hill