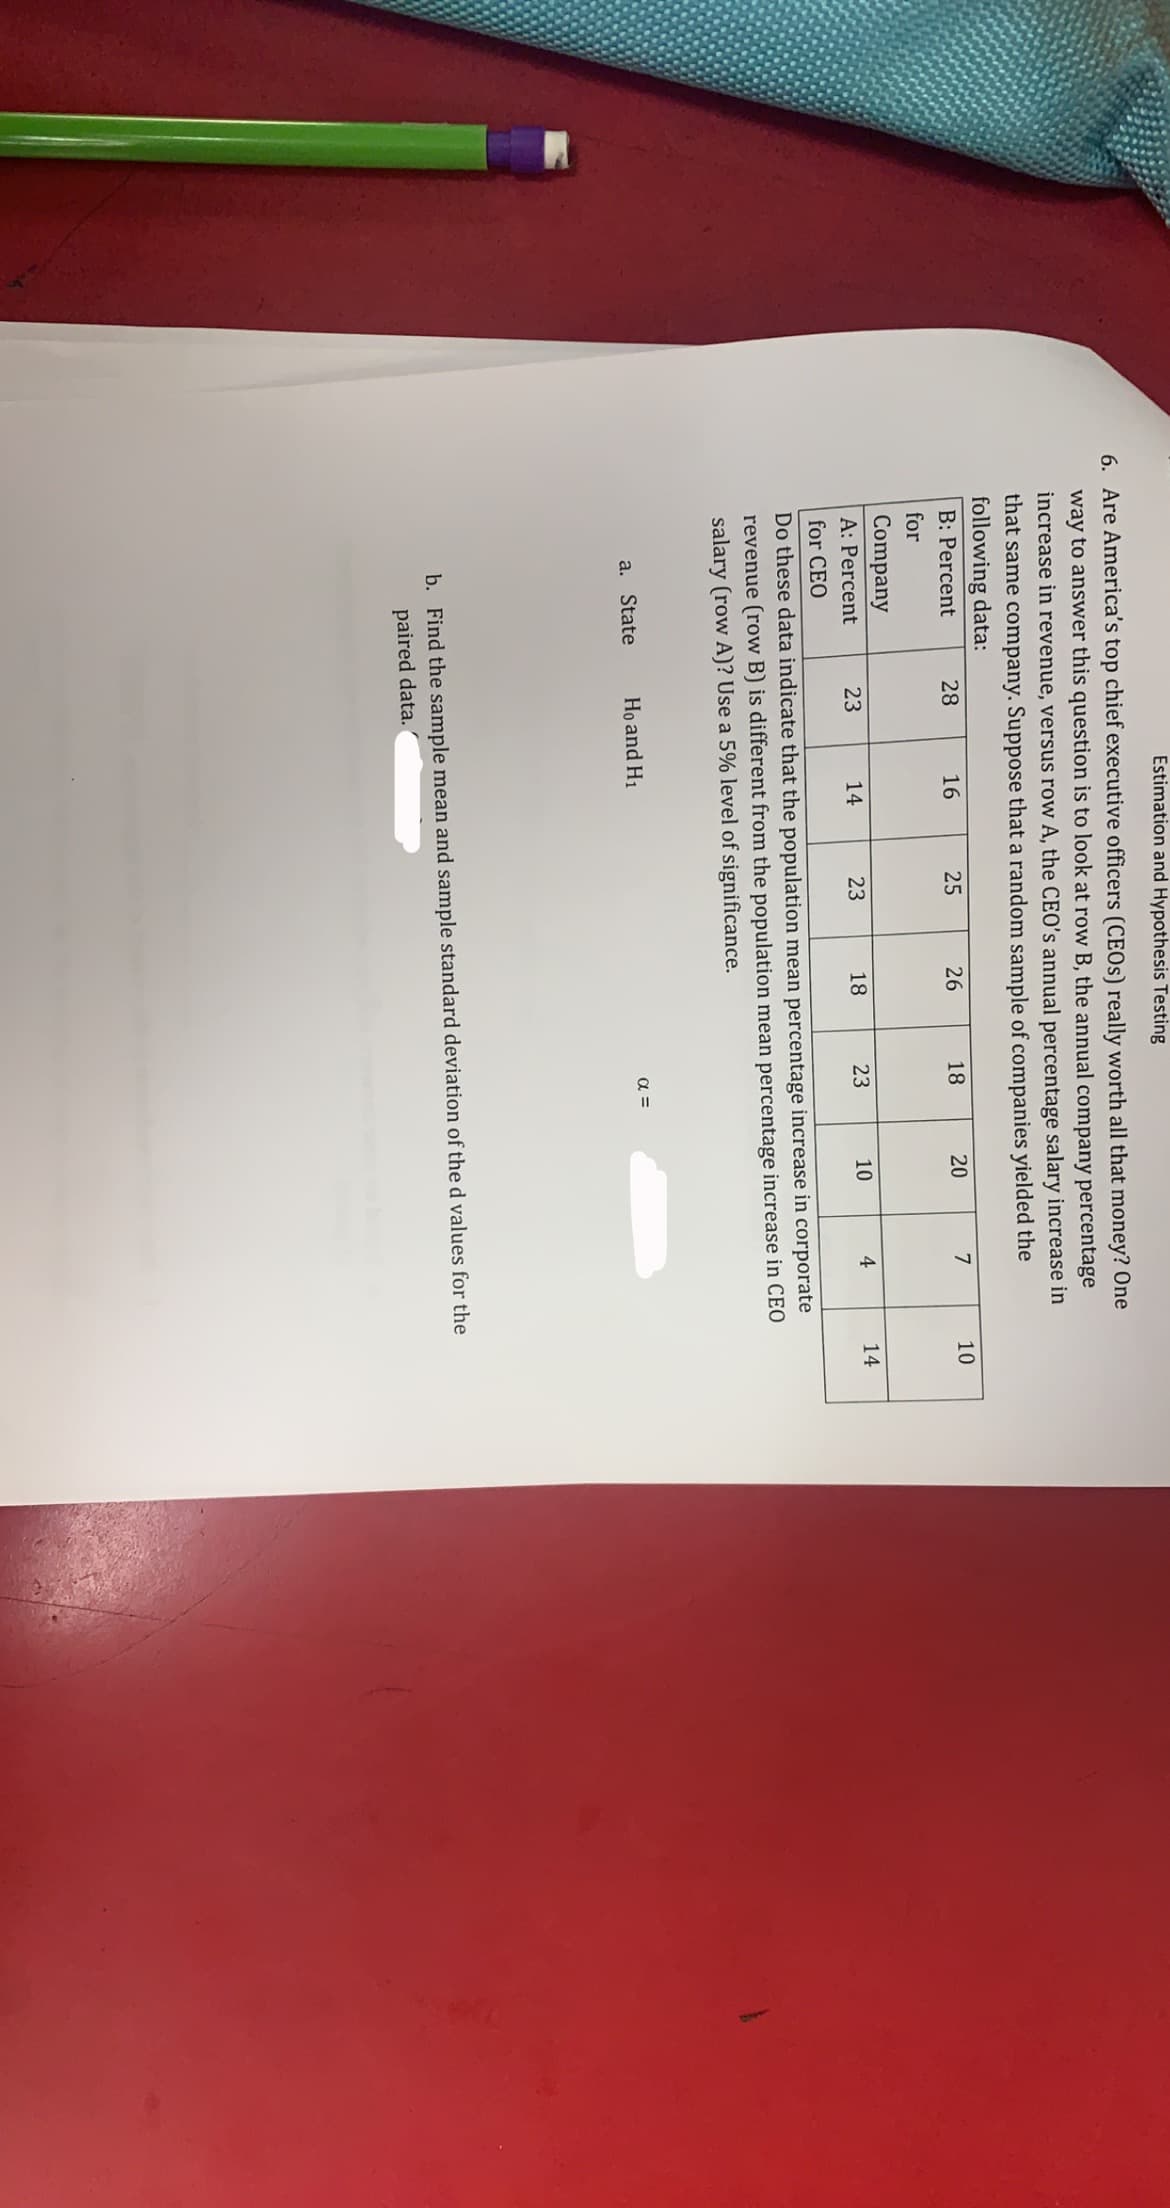
6. Are America's top chief executive officers (CEOS) really worth all that money? Öne way to answer this question is to look at row B, the annual company percentage increase in revenue, versus row A, the CEO's annual percentage salary increase in that same company. Suppose that a random sample of companies yielded the following data: B: Percent 28 16 25 26 18 20 10 for Company A: Percent 23 14 23 18 23 10 4 14 for CEO Do these data indicate that the population mean percentage increase in corporate revenue (row B) is different from the population mean percentage increase in CEO salary (row A)? Use a 5% level of significance. a. State Ho and H1 b. Find the sample mean and sample standard deviation of the d values for the paired data.
6. Are America's top chief executive officers (CEOS) really worth all that money? Öne way to answer this question is to look at row B, the annual company percentage increase in revenue, versus row A, the CEO's annual percentage salary increase in that same company. Suppose that a random sample of companies yielded the following data: B: Percent 28 16 25 26 18 20 10 for Company A: Percent 23 14 23 18 23 10 4 14 for CEO Do these data indicate that the population mean percentage increase in corporate revenue (row B) is different from the population mean percentage increase in CEO salary (row A)? Use a 5% level of significance. a. State Ho and H1 b. Find the sample mean and sample standard deviation of the d values for the paired data.
Holt Mcdougal Larson Pre-algebra: Student Edition 2012
1st Edition
ISBN:9780547587776
Author:HOLT MCDOUGAL
Publisher:HOLT MCDOUGAL
Chapter11: Data Analysis And Probability
Section: Chapter Questions
Problem 6CST
Related questions
Question

Transcribed Image Text:Estimation and Hypothesis Testing
6. Are America's top chief executive officers (CEOS) really worth all that money? One
way to answer this question is to look at row B, the annual company percentage
increase in revenue, versus row A, the CEO's annual percentage salary increase in
that same company. Suppose that a random sample of companies yielded the
following data:
B: Percent
28
16
25
26
18
20
7
10
for
Company
A: Percent
23
14
23
18
10
4
14
for CEO
Do these data indicate that the population mean percentage increase in corporate
revenue (row B) is different from the population mean percentage increase in CEO
salary (row A)? Use a 5% level of significance.
a. State
Ho and H1
a =
b. Find the sample mean and sample standard deviation of the d values for the
paired data.

Transcribed Image Text:Estimation and Hypothesis Testing
c. What is the value of the sample test statistic? (
d. Determine the critical region and critical value based on your level of
significance. Sketch the critical value & show the area corresponding to the
critical region. Plot the sample test statistic on the sketch.
e. Based on your answers, will you reject or fail to reject the null hypotheses?
f. State your conclusion in the context of the application. (
Expert Solution
This question has been solved!
Explore an expertly crafted, step-by-step solution for a thorough understanding of key concepts.
This is a popular solution!
Trending now
This is a popular solution!
Step by step
Solved in 4 steps

Recommended textbooks for you

Holt Mcdougal Larson Pre-algebra: Student Edition…
Algebra
ISBN:
9780547587776
Author:
HOLT MCDOUGAL
Publisher:
HOLT MCDOUGAL


College Algebra (MindTap Course List)
Algebra
ISBN:
9781305652231
Author:
R. David Gustafson, Jeff Hughes
Publisher:
Cengage Learning

Holt Mcdougal Larson Pre-algebra: Student Edition…
Algebra
ISBN:
9780547587776
Author:
HOLT MCDOUGAL
Publisher:
HOLT MCDOUGAL


College Algebra (MindTap Course List)
Algebra
ISBN:
9781305652231
Author:
R. David Gustafson, Jeff Hughes
Publisher:
Cengage Learning