6.- The day after Thanksgiving-called Black Friday–is one of the largest shopping days in the United States. A group of researchers conducted interviews with a sample of 38 women shopping on Black Friday to gauge their shopping habits and reported the results in a published paper, in 2011. One question was, “How many hours do you usually spend shopping on Black Friday?" Data for the 38 shoppers are listed here: 6644 3 16 4 456 6 5 5 4 6 5 64 5 4 4 4 7 12 5 8 6 10 5 8 8 3 3856 10 11. Descriptive statistics for these data are in this table: A Explore Data - Descriptive Statistics Options Which column of data would you like to explore? Eplore Data Colum4 Summary statistiest Mean Column Variance Sid. dev. Std. err. Median Range Min Max QI QI 16 4 7 Sample Size, n Meani Wediant Midrange: 34 6.07947 vard 38 60789474 7.5881935 2.7546676 0 44686609 9.5 6.650967 7.588193 Variance, A21 Standard Deviation, s 2.7546 Mean Abselute Deviation 1.958449 13 Koefficient of Varianice: 4S. 3IN Range a) Use the information in the table to estimate the population mean number of hours spent shopping on Black Friday with a 95% confidence interval. Answer: b) A retail store advertises that the true mean number of hours spent shopping on Black Friday is µ = 5.5 hours. Do you agree with this claim? Use a two-tailed alternative hypothesis, with a = 0.05. %3D Test statistics = P-value = CV = Conclusion: Keep H. Answer: RR = Reject H. c) Given the histogram, box plot, and the normality plot below, do you think the test using the normality assumption is valid? Answer: YES NO
6.- The day after Thanksgiving-called Black Friday–is one of the largest shopping days in the United States. A group of researchers conducted interviews with a sample of 38 women shopping on Black Friday to gauge their shopping habits and reported the results in a published paper, in 2011. One question was, “How many hours do you usually spend shopping on Black Friday?" Data for the 38 shoppers are listed here: 6644 3 16 4 456 6 5 5 4 6 5 64 5 4 4 4 7 12 5 8 6 10 5 8 8 3 3856 10 11. Descriptive statistics for these data are in this table: A Explore Data - Descriptive Statistics Options Which column of data would you like to explore? Eplore Data Colum4 Summary statistiest Mean Column Variance Sid. dev. Std. err. Median Range Min Max QI QI 16 4 7 Sample Size, n Meani Wediant Midrange: 34 6.07947 vard 38 60789474 7.5881935 2.7546676 0 44686609 9.5 6.650967 7.588193 Variance, A21 Standard Deviation, s 2.7546 Mean Abselute Deviation 1.958449 13 Koefficient of Varianice: 4S. 3IN Range a) Use the information in the table to estimate the population mean number of hours spent shopping on Black Friday with a 95% confidence interval. Answer: b) A retail store advertises that the true mean number of hours spent shopping on Black Friday is µ = 5.5 hours. Do you agree with this claim? Use a two-tailed alternative hypothesis, with a = 0.05. %3D Test statistics = P-value = CV = Conclusion: Keep H. Answer: RR = Reject H. c) Given the histogram, box plot, and the normality plot below, do you think the test using the normality assumption is valid? Answer: YES NO

Glencoe Algebra 1, Student Edition, 9780079039897, 0079039898, 2018
18th Edition
ISBN:9780079039897
Author:Carter
Publisher:Carter
Chapter4: Equations Of Linear Functions
Section4.5: Correlation And Causation
Problem 2CYU

Related questions
Question
Transcribed Image Text:Rangecient of Variaice: 45.31N
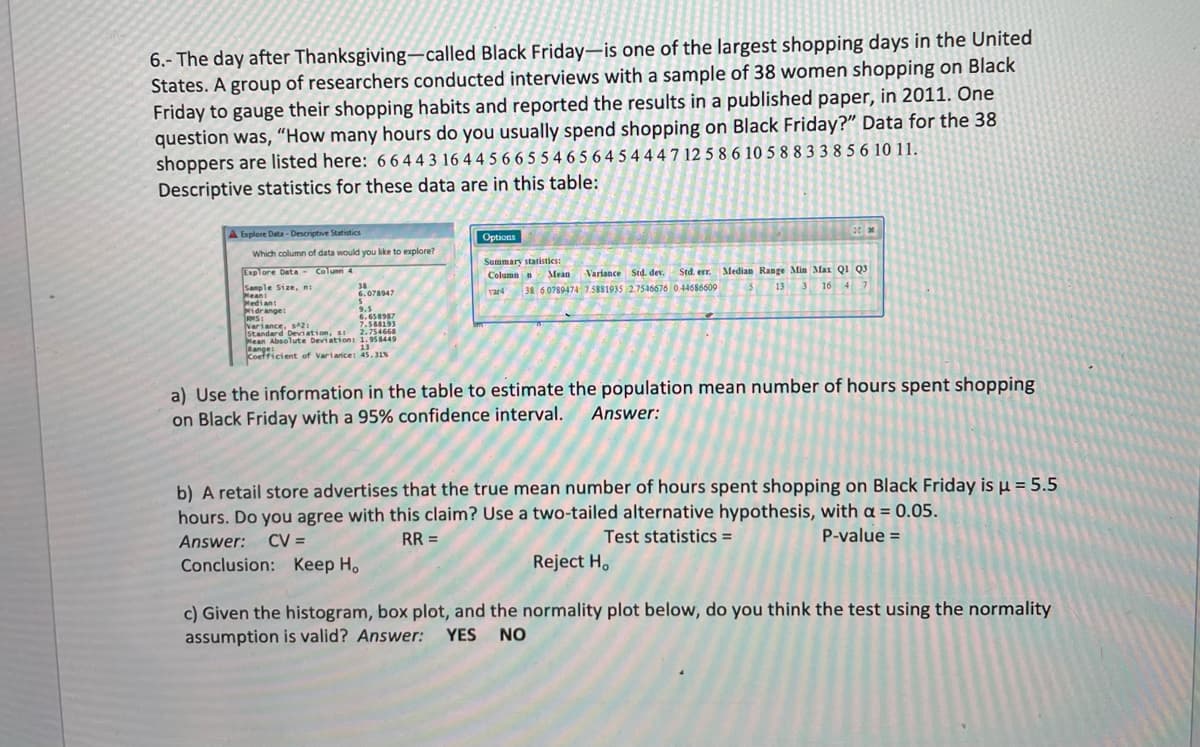
6.- The day after Thanksgiving-called Black Friday–is one of the largest shopping days in the United
States. A group of researchers conducted interviews with a sample of 38 women shopping on Black
Friday to gauge their shopping habits and reported the results in a published paper, in 2011. One
question was, "“How many hours do you usually spend shopping on Black Friday?" Data for the 38
shoppers are listed here: 66443 16 4 4 5 6 6 5 5 4 6 5 6 4 5 4 44 7 12 5 86 10 5 8 8 3 38 5 6 10 11.
Descriptive statistics for these data are in this table:
AExplore Data - Descriptive Statistics
Options
Which column of data would you like to explore?
Summary statistics:
Explore Data - Column 4
Variance Std. dev. Std. err.
. Median Range Min Max Q1 Q3
Column n
Mean
Sample Size, ni
38
6.078947
38 6 0789474 7 5881935 2.7546676 044686609
13
3
16 4 7
var4
Meani
Nedi an:
Midrange:
9.5
6.658987
7.588193
Standard Deviation, s I 2.754668
Mean Absolute Deviation 1.958449
Variance, sA2:
13
Koefticient of Variarice: 4S. 31N
a) Use the information in the table to estimate the population mean number of hours spent shopping
on Black Friday with a 95% confidence interval. Answer:
b) A retail store advertises that the true mean number of hours spent shopping on Black Friday is µ = 5.5
hours. Do you agree with this claim? Use a two-tailed alternative hypothesis, with a = 0.05.
Test statistics =
P-value =
CV =
Conclusion: Keep H.
Answer:
RR =
Reject H.
c) Given the histogram, box plot, and the normality plot below, do you think the test using the normality
assumption is valid? Answer: YES NO
Expert Solution
This question has been solved!
Explore an expertly crafted, step-by-step solution for a thorough understanding of key concepts.

This is a popular solution!

Trending now
This is a popular solution!

Step by step
Solved in 4 steps with 1 images

Recommended textbooks for you
Glencoe Algebra 1, Student Edition, 9780079039897…
Algebra
ISBN:
9780079039897
Author:
Carter
Publisher:
McGraw Hill

Holt Mcdougal Larson Pre-algebra: Student Edition…
Algebra
ISBN:
9780547587776
Author:
HOLT MCDOUGAL
Publisher:
HOLT MCDOUGAL
Glencoe Algebra 1, Student Edition, 9780079039897…
Algebra
ISBN:
9780079039897
Author:
Carter
Publisher:
McGraw Hill
Holt Mcdougal Larson Pre-algebra: Student Edition…
Algebra
ISBN:
9780547587776
Author:
HOLT MCDOUGAL
Publisher:
HOLT MCDOUGAL