684 APPENDIX A Tables A XI NEGATIVE z Scores TABLE A- TABLE A-2 Standard Normal (z) Distribution: Cumulative Area from the LEFT 0.0 .00 .01 .02 .03 .04 .05 .06 .07 .08 .09 0.1 -3.50 and 0.2 lower .0001 .0003 .0003 .0002 0.3 -3.4 .0003 .0003 .0003 .0003 .0003 .0003 .0003 .0005 .0005 .0005 .0004 .0004 .0004 .0004 .0004 .0004 .0003 0.4 -3.3 -3.2 .0007 .0007 .0006 .0006 .0006 .0006 .0006 .0005 .0005 .0005 0.5 -3.1 .0010 .0009 .0009 .0009 .0008 .0008 .0008 .0008 .0007 .0007 0.6 -3.0 .0013 .0013 .0013 .0012 .0012 .0011 .0011 .0011 .0010 .0010 0.7 -2.9 .0019 .0018 .0018 .0017 .0016 .0016 .0015 .0015 .0014 .0014 0.8 -2.8 .0026 .0025 .0024 .0023 .0023 .0022 .0021 .0021 .0020 .0019 0.9 -2.7 .0035 .0034 .0033 .0032 .0031 .0030 .0029 .0028 .0027 .0026 1.0 -2.6 .0047 .0045 .0044 .0043 .0041 .0040 .0039 .0038 .0037 .0036 1.1 -2.5 .0062 .0060 .0059 .0057 .0055 .0054 .0052 .0051 .0049 .0048 1.2 -2.4 .0082 .0080 .0078 .0075 .0073 .0071 .0069 .0068 .0066 .0064 1.3 -2.3 .0107 .0104 .0102 .0099 .0096 .0094 .0091 .0089 .0087 .0084 1.4 -2.2 .0139 .0136 .0132 .0129 .0125 .0122 .0119 .0116 .0113 .0110 1. -2.1 .0179 .0174 .0170 .0166 .0162 .0158 .0154 .0150 .0146 .0143 -2.0 .0228 .0222 .0217 .0212 .0207 .0202 .0197 .0192 .0188 .0183 -1.9 .0287 .0281 .0274 .0268 .0262 .0256 .0250 .0244 .0239 .0233 -1.8 .0359 .0351 .0344 .0336 .0329 .0322 .0314 .0307 .0301 .0294 -1.7 .0446 .0436 .0427 .0418 .0409 .0401 .0392 .0384 .0375 .0367 -1.6 .0548 .0537 .0526 .0516 .0505 .0495 .0485 .0475 .0465 .0455 -1.5 .0668 .0655 .0643 .0630 .0618 .0606 .0594 .0582 .0571 .0559 -1.4 .0808 .0793 .0778 .0764 .0749 .0735 .0721 .0708 .0694 .0681 -1.3 .0968 .0951 .0934 .0918 .0901 .0885 .0869 .0853 .0838 .0823 -1.2 .1151 .1131 .1112 .1093 .1075 .1056 .1038 .1020 .1003 .0985 -1.1 .1357 .1335 .1314 .1292 .1271 .1251 .1230 .1210 .1190 .1170 -1.0 .1587 .1562 .1539 .1515 .1492 .1469 .1446 .1423 .1401 .1379 -0.9 .1841 .1814 .1788 .1762 .1736 .1711 .1685 .1660 .1635 .1611 -0.8 .2119 .2090 .2061 .2033 .2005 .1977 .1949 .1922 .1894 .1867 -0.7 .2420 .2389 .2358 .2327 .2296 .2266 .2236 .2206 .2177 .2148 -0.6 .2743 .2709 .2676 .2643 .2611 .2578 .2546 .2514 .2483 .2451 -0.5 .3085 .3050 .3015 .2981 .2946 .2912 .2877 .2843 .2810 2776 -0.4 .3446 .3409 .3372 .3336 .3300 .3264 .3228 .3192 .3156 .3121 -0.3 .3821 .3783 .3745 .3707 .3669 .3632 .3594 .3557 .3520 .3483 -0.2 4207 .4168 .4129 .4090 .4052 4013 .3974 .3936 .3897 .3859 -0.1 4602 4562 4522 .4483 .4443 .4404 .4364 .4325 .4286 4247 -0.0 .5000 4960 4920 4880 .4840 .4801 .4761 .4721 .4681 4641 NOTE: For values of z below-3.49, use 0.0001 for the area. (continued) *Use these common values that result from interpolation: z Score Area -1.645 0.0500 -2.575 0.0050 APPENDIX A Tables 685 HA ABJBAT POSITIVE Zz Scores TABLE A-2 (continued) Cumulative Area from the LEFT .00 .01 09 .02 0.0 .5000 .03 .5040 .04 .5080 .05 .06 .07 .08 .09 0.1 .5398 .5438 .5120 .5160 .5478 .5199 .5239 .5279 .5319 .5359 0.2 .5793 .5517 .5832 .5557 .5871 .5596 .5636 .5675 .5714 .5753 0.3 .6179 .5910 .6217 .6255 .5948 .5987 .6026 .6064 .6103 .6141 0.4 .6554 .6591 .6293 .6331 .6628 .6368 .6406 .6443 .6480 .6517 0.5 .6915 .6664 .6700 .6950 .6985 .6736 .6772 .6808 .6844 .6879 .7019 0.6 .7257 .7291 .7054 .7088 .7324 .7123 .7157 .7190 .7224 .7357 0.7 .7580 .7611 .7389 .7422 .7454 .7486 .7517 .7642 .7549 .7673 0.8 .7881 .7910 .7704 .7734 .7764 .7794 .7823 .7939 .7852 .7967 0.9 .8159 .8186 .7995 .8023 .8051 .8078 .8106 .8133 .8212 .8238 1.0 .8413 .8438 .8264 .8289 .8315 .8340 .8365 .8389 .8461 .8485 .8508 1.1 .8643 .8665 .8531 .8554 .8577 .8599 .8621 .8686 .8708 .8729 .8749 .8770 .8790 .8810 .8830 1.2 .8849 .8869 .8888 .8907 .8925 .8944 .8962 .8980 .8997 .9015 1.3 .9032 .9049 .9066 .9082 .9099 .9115 .9131 .9147 .9162 .9177 1.4 .9192 .9207 .9222 .9236 .9251 .9265 .9279 .9292 .9306 .9319 1.5 .9332 .9345 .9357 .9370 .9382 .9394 .9406 .9418 .9429 .9441 1.6 .9452 .9463 .9474 .9484 .9495 .9505 .9515 .9525 .9535 .9545 1.7 .9554 .9564 .9573 .9582 .9591 .9599 .9608 .9616 .9625 .9633 1.8 .9641 .9649 .9656 .9664 .9671 .9678 .9686 .9693 .9699 .9706 1.9 .9713 .9719 .9726 .9732 .9738 .9744 .9750 .9756 .9761 .9767 2.0 .9772 .9778 .9783 .9788 .9793 .9798 .9803 .9808 .9812 .9817 2.1 .9821 .9826 .9830 .9834 .9838 .9842 .9846 .9850 .9854 .9857 2.2 .9861 .9864 .9868 .9871 .9875 .9878 .9881 .9884 .9887 .9890 2.3 .9893 .9896 .9898 .9901 .9904 .9906 .9909 .9911 .9913 .9916 2.4 .9918 .9920 .9922 .9925 .9927 .9929 .9931 .9932 .9934 .9936 2.5 .9938 .9940 .9941 .9943 .9945 .9946 .9948 .9949 .9951 .9952 2.6 .9953 .9955 .9956 .9957 .9959 .9960 .9961 .9962 .9963 .9964 2.7 .9965 .9966 .9967 .9968 .9969 .9970 .9971 .9972 .9973 .9974 2.8 .9974 .9975 .9976 ,9977 .9977 .9978 .9979 .9979 .9980 .9981 .9982 .9983 .9984 .9984 .9985 .9985 .9986 .9986 2.9 .9981 .9982 .9987 .9988 .9988 .9989 .9989 .9989 .9990 .9990 3.0 .9987 .9987 .9991 .9992 .9992 .9992 .9992 .9993 .9993 3.1 .9990 .9991 .9991 .9994 .9994 .9994 .9994 .9995 .9995 .9995 3.2 .9993 .9993 .9994 .9996 .9996 .9996 .9996 .9996 .9996 .9997 3.3 .9995 .9995 .9995 .9997 ,9997 .9997 .9997 .9997 .9997 .9998 3.4 .9997 .9997 .9997 3.50 and up ,9999 Common Critical Values NOTE: For values of z above 3.49, use 0.9999 for the area. Confidence Critical Level Value 0.90 1.645 Ude these common values that result from interpolation: 0.95 1.96 z Score Area 0.99 2.575 1.645 0.9500 2.575 0.9950


Continuous Probability Distributions
Probability distributions are of two types, which are continuous probability distributions and discrete probability distributions. A continuous probability distribution contains an infinite number of values. For example, if time is infinite: you could count from 0 to a trillion seconds, billion seconds, so on indefinitely. A discrete probability distribution consists of only a countable set of possible values.
Normal Distribution
Suppose we had to design a bathroom weighing scale, how would we decide what should be the range of the weighing machine? Would we take the highest recorded human weight in history and use that as the upper limit for our weighing scale? This may not be a great idea as the sensitivity of the scale would get reduced if the range is too large. At the same time, if we keep the upper limit too low, it may not be usable for a large percentage of the population!
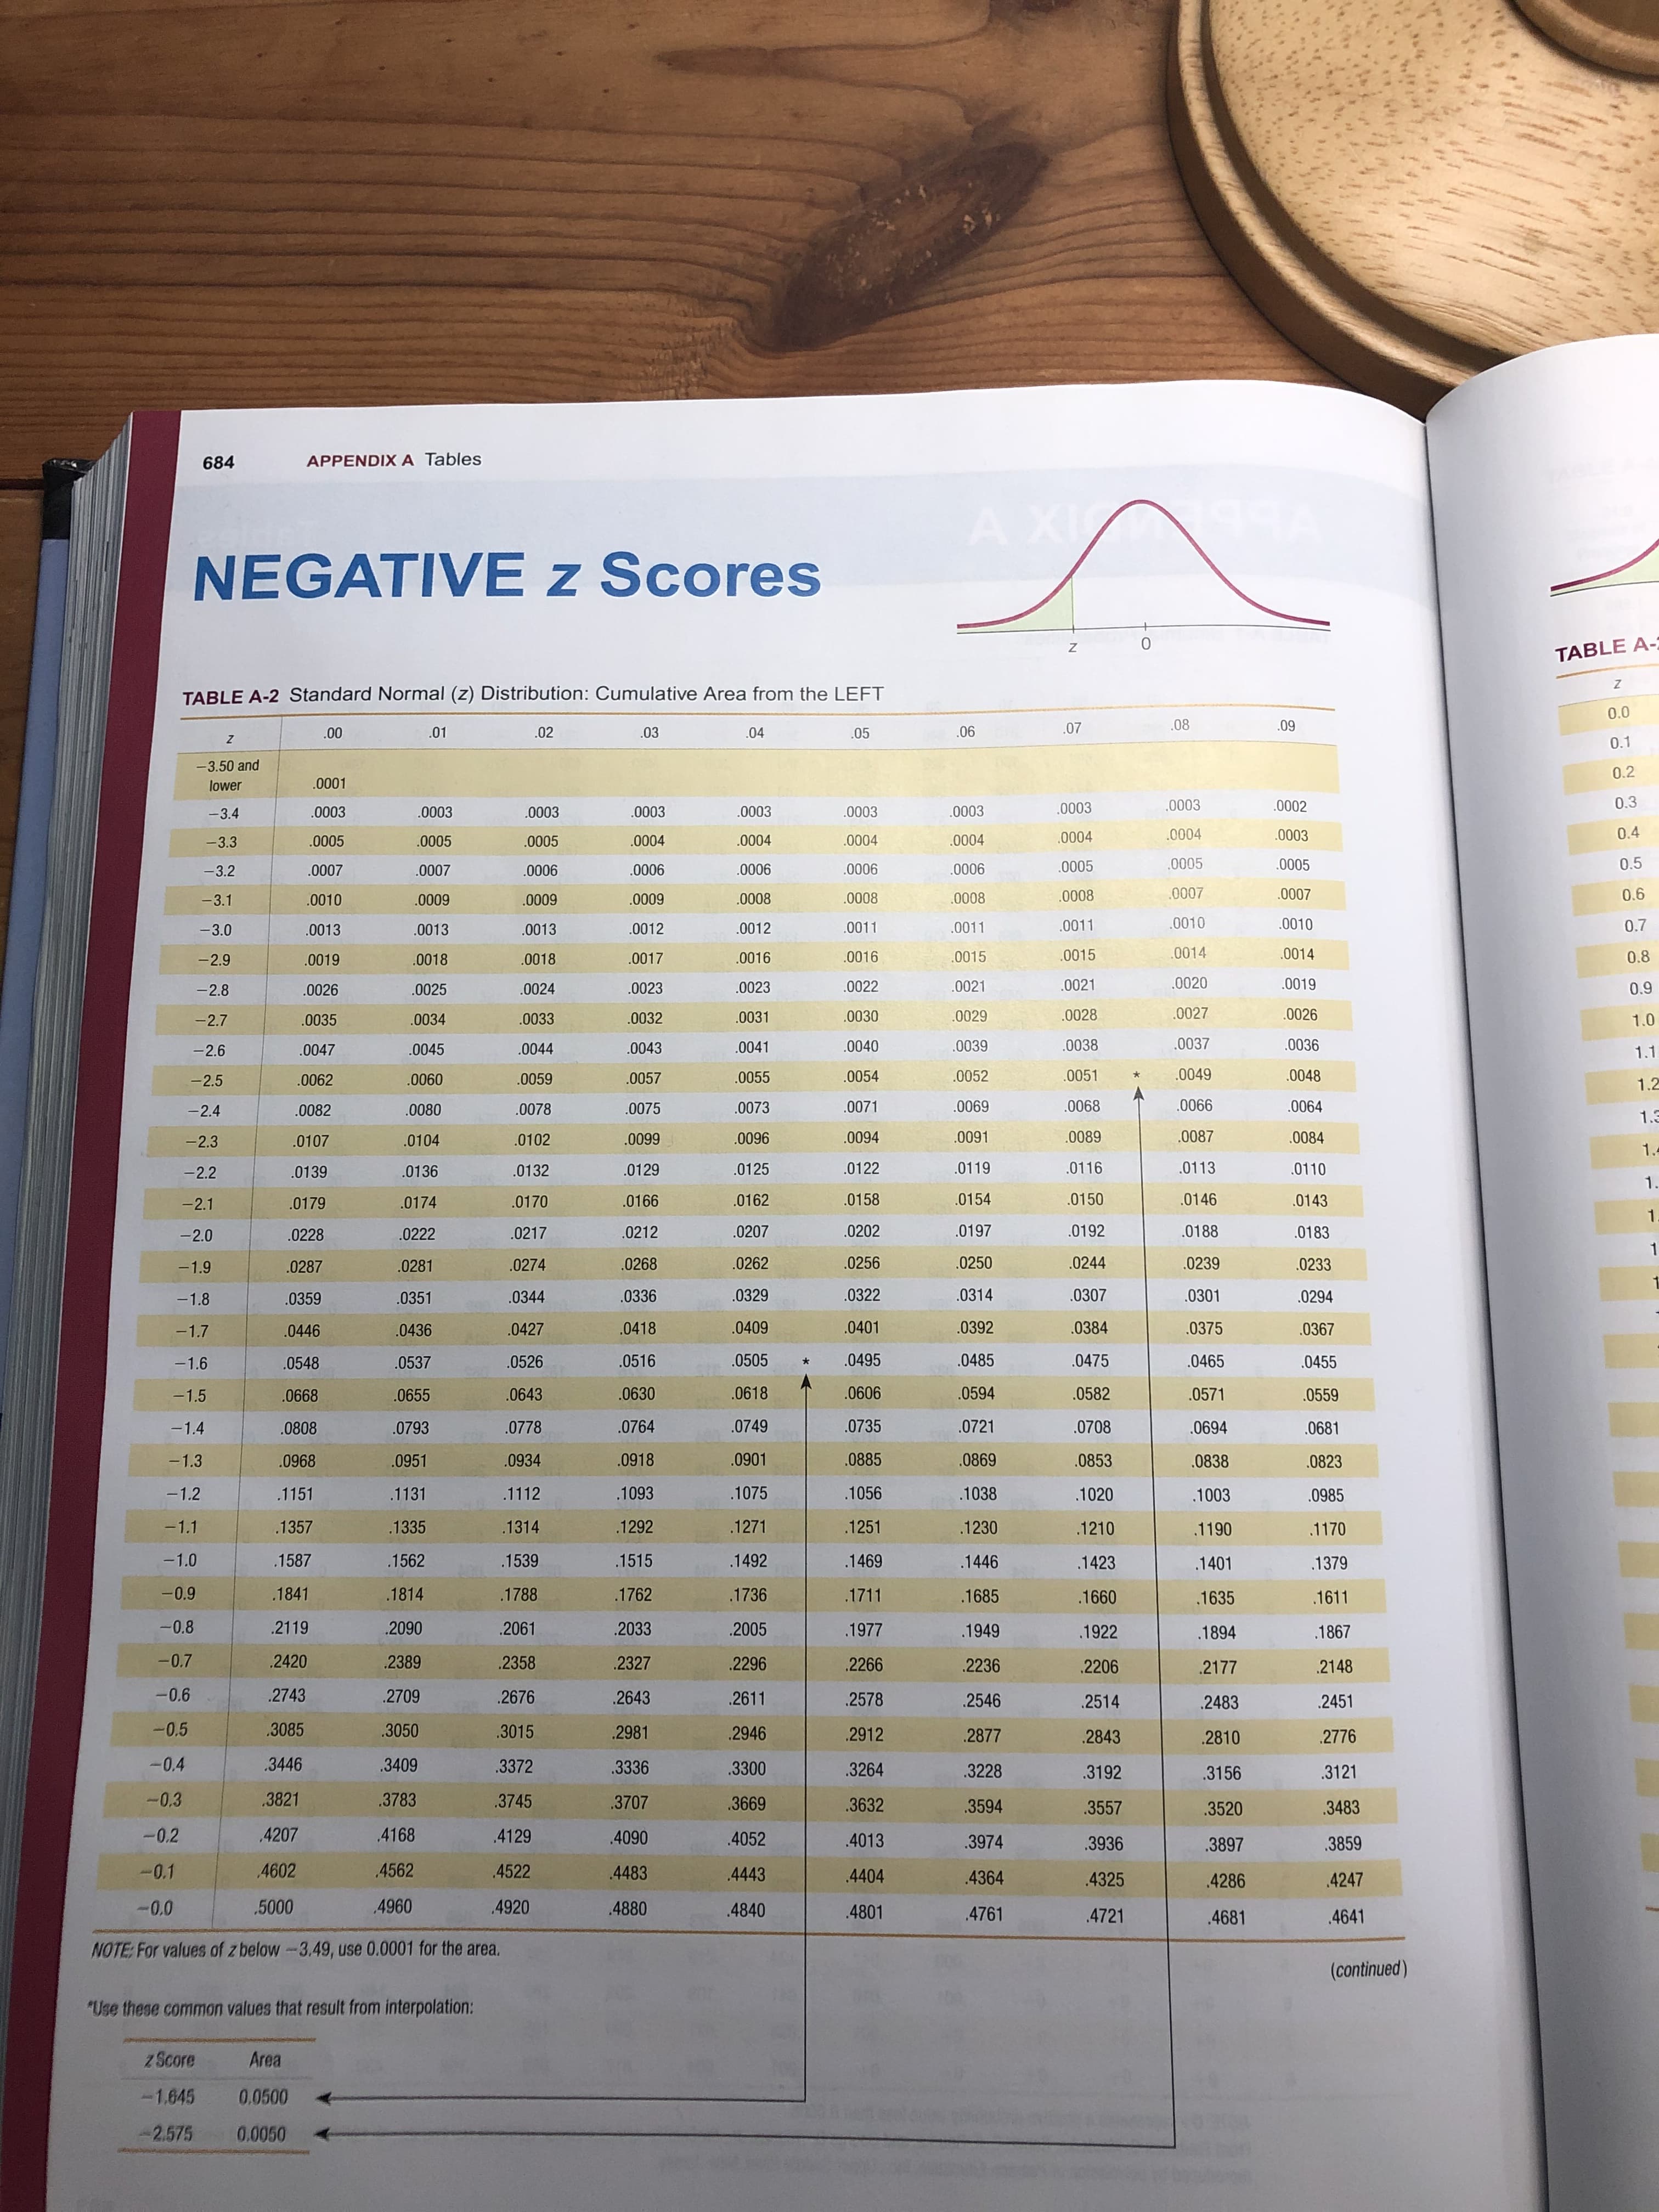
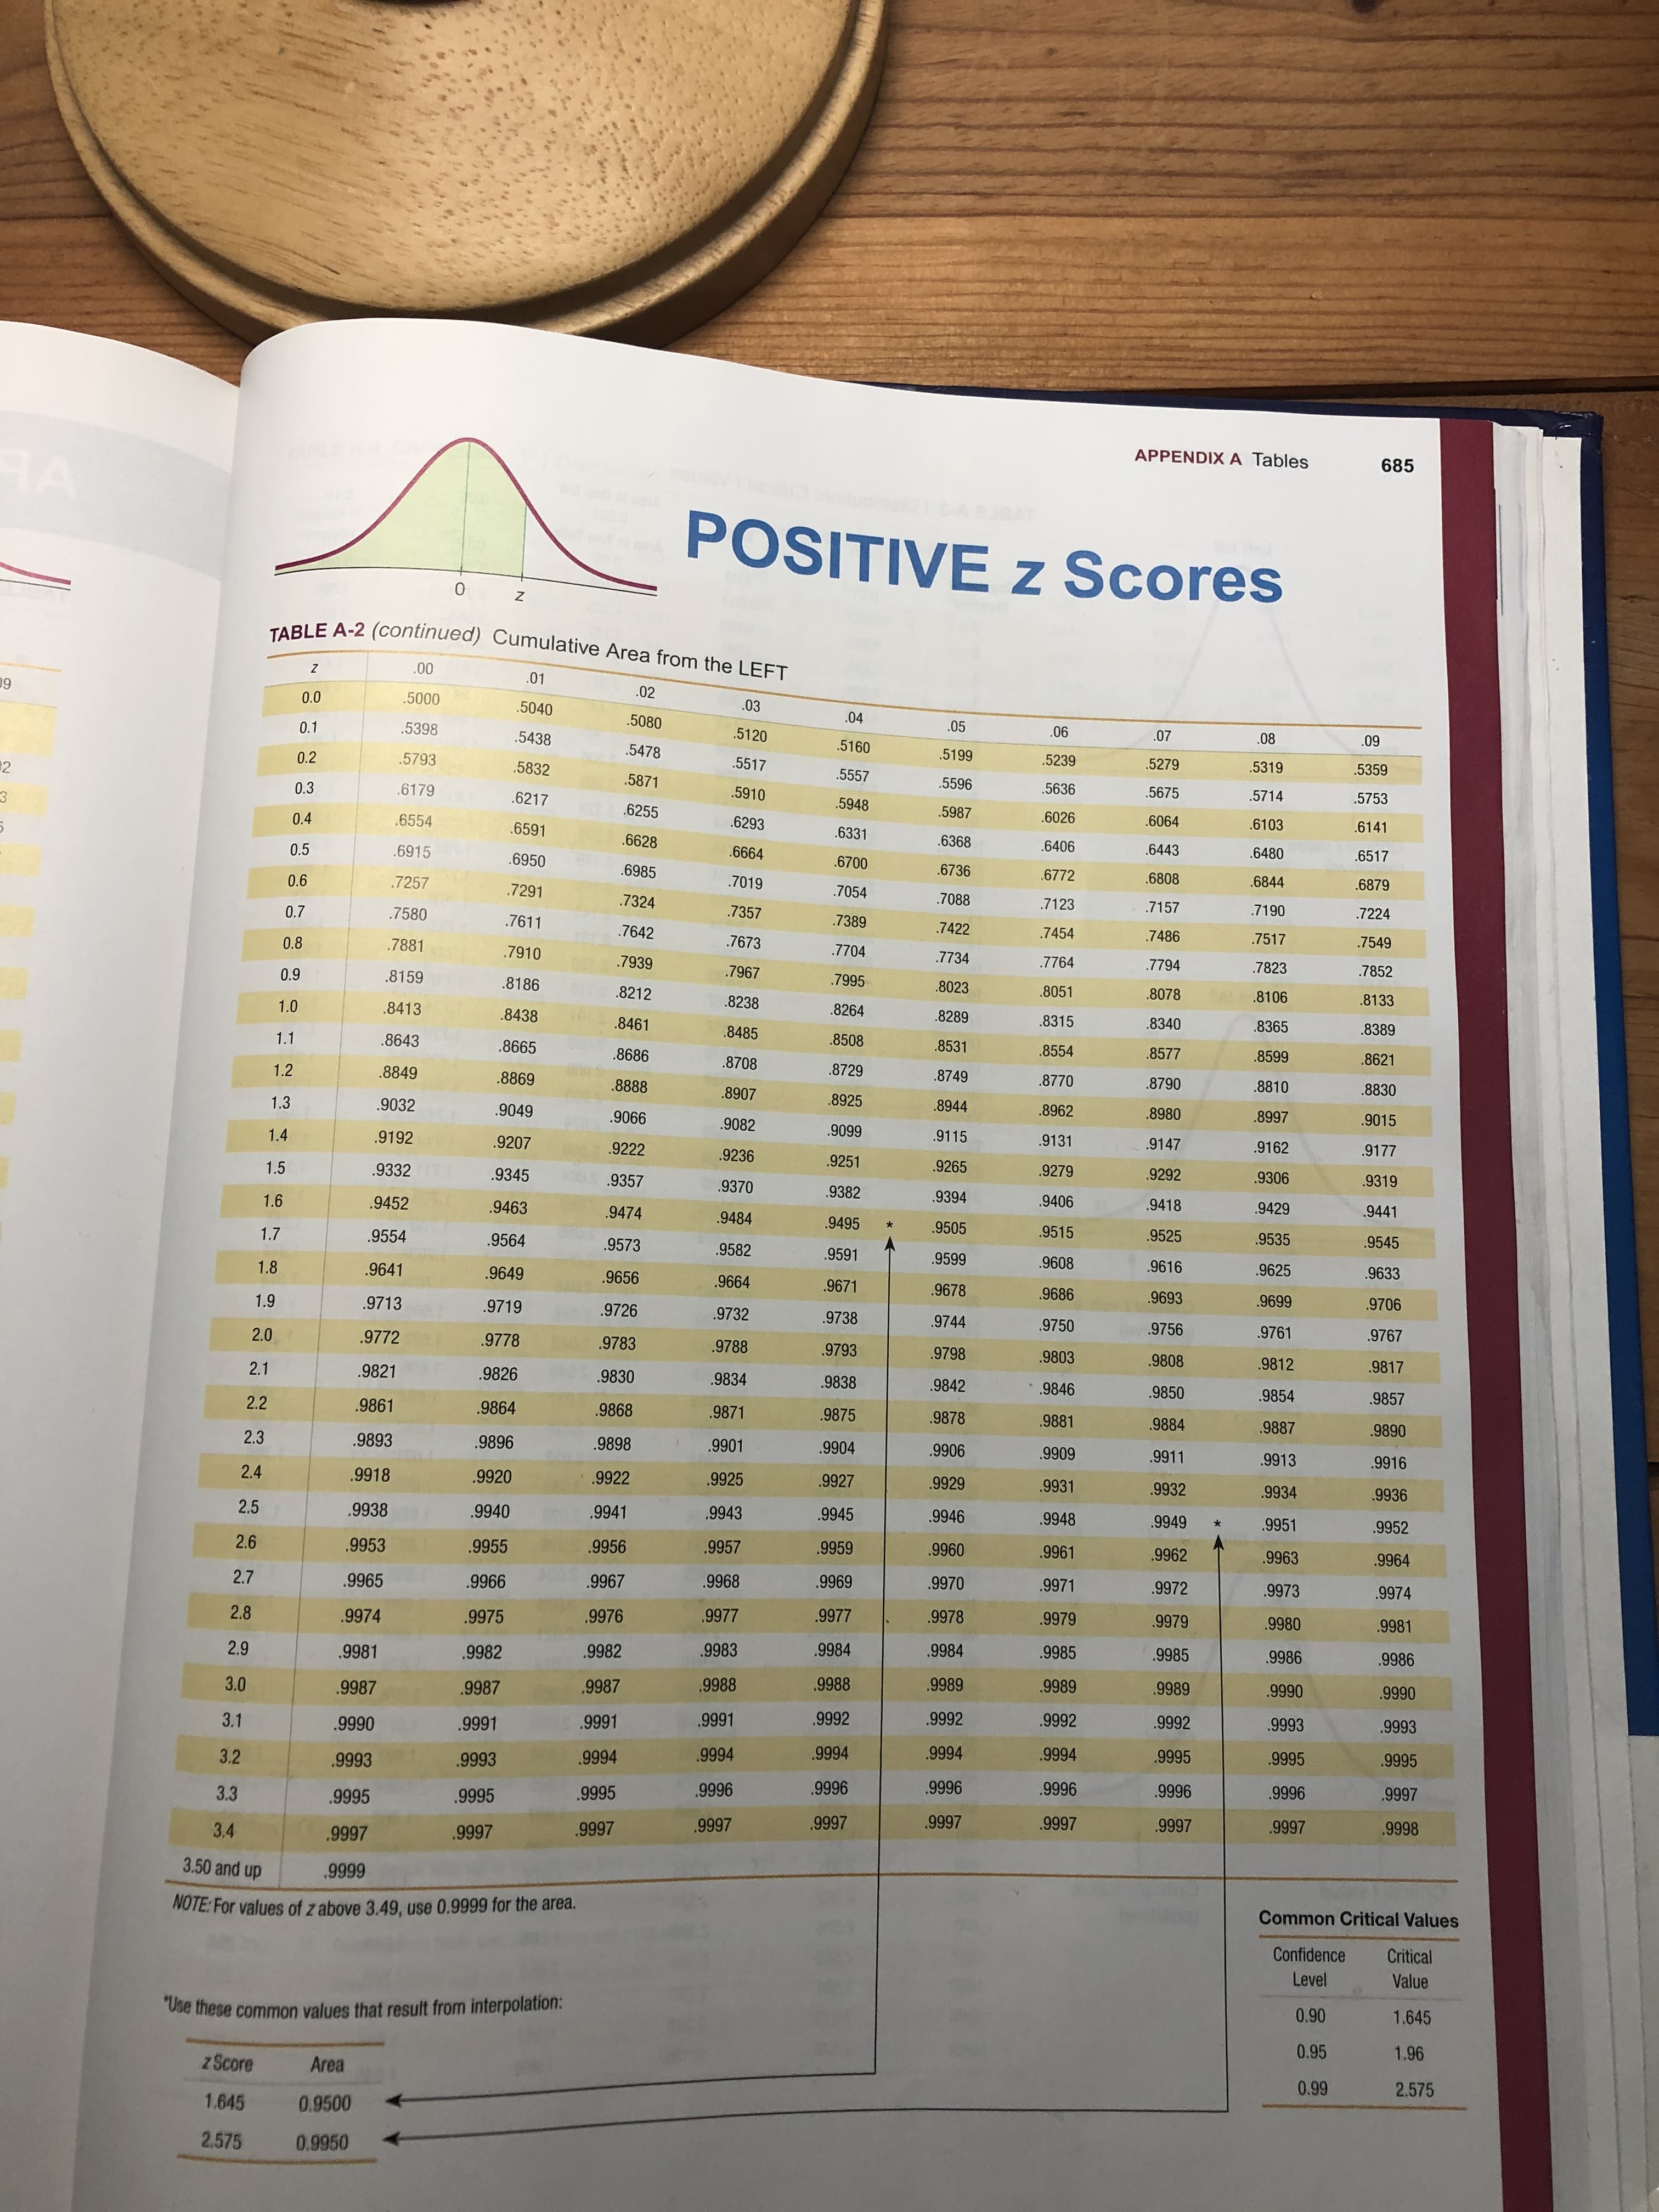
Using the same information as for number 6 above, Find P5 the 5th percentile. This is the bone density score separating the bottom 5% from the top 95%.
PLEASE SHOW ALL WORK!!!
This is number 6:
In the following two problems assume that a randomly selected subject is given a bone density test. The test scores are
a) Less than -0.19
b) Between 1.23 and 2.37

Step by step
Solved in 2 steps with 2 images


