7. Critical analysis Q14 Suppose that you produce and sell children's tables in a local market. Past experience enables you to estimate your demand and marginal cost schedules. This information is presented in the accompanying table. Complete the following table by computing the total cost of producing each quantity. Then, compute the total revenue earned at each price level and the marginal revenue earned at each price level. Price ($ per table) 45 40 35 30 25 20 Quantity Demanded (Tables per Week) 1 2 3 4 5 6 Fixed Cost Total Cost Marginal Cost ($) ($) ($) 40 40 40 40 40 40 SSSS $ $ 70 AAAAA 9 27 29 35 45 Total Revenue Marginal Revenue ($) ($) $ $ $ $ S $ AAAAA $ $ $
7. Critical analysis Q14 Suppose that you produce and sell children's tables in a local market. Past experience enables you to estimate your demand and marginal cost schedules. This information is presented in the accompanying table. Complete the following table by computing the total cost of producing each quantity. Then, compute the total revenue earned at each price level and the marginal revenue earned at each price level. Price ($ per table) 45 40 35 30 25 20 Quantity Demanded (Tables per Week) 1 2 3 4 5 6 Fixed Cost Total Cost Marginal Cost ($) ($) ($) 40 40 40 40 40 40 SSSS $ $ 70 AAAAA 9 27 29 35 45 Total Revenue Marginal Revenue ($) ($) $ $ $ $ S $ AAAAA $ $ $

Chapter11: Resource Market
Section: Chapter Questions
Problem 2.4P

Related questions
Question
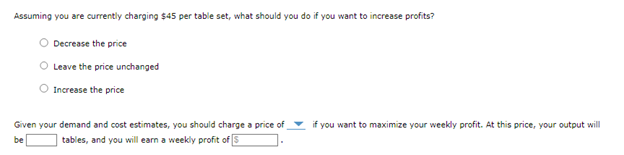
Transcribed Image Text:Assuming you are currently charging $45 per table set, what should you do if you want to increase profits?
Decrease the price
Leave the price unchanged
Increase the price
Given your demand and cost estimates, you should charge a price of
tables, and you will earn a weekly profit of 5
be
if you want to maximize your weekly profit. At this price, your output will
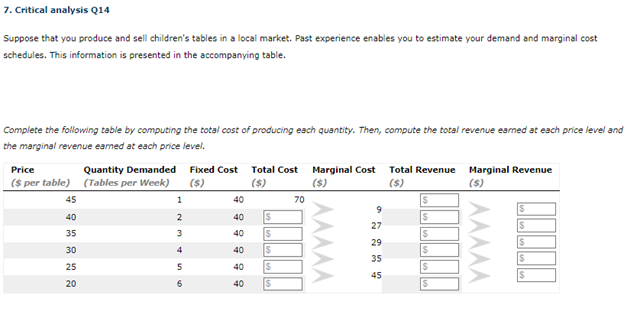
Transcribed Image Text:7. Critical analysis Q14
Suppose that you produce and sell children's tables in a local market. Past experience enables you to estimate your demand and marginal cost
schedules. This information is presented in the accompanying table.
Complete the following table by computing the total cost of producing each quantity. Then, compute the total revenue earned at each price level and
the marginal revenue earned at each price level.
Price
($ per table)
45
40
35
30
25
20
Quantity Demanded
(Tables per Week)
1
2
3
4
5
6
Fixed Cost Total Cost Marginal Cost
($)
($)
($)
40
40
40
40
40
40
SSSS
$
$
70
AAAAA
9
27
29
35
45
Total Revenue Marginal Revenue
($)
($)
$
$
$
$
S
$
AAAAA
$
$
$
Expert Solution
This question has been solved!
Explore an expertly crafted, step-by-step solution for a thorough understanding of key concepts.

This is a popular solution!

Trending now
This is a popular solution!

Step by step
Solved in 4 steps with 2 images

Knowledge Booster


Learn more about
Need a deep-dive on the concept behind this application? Look no further. Learn more about this topic, economics and related others by exploring similar questions and additional content below.Recommended textbooks for you

Principles of Economics 2e
Economics
ISBN:
9781947172364
Author:
Steven A. Greenlaw; David Shapiro
Publisher:
OpenStax

Managerial Economics: Applications, Strategies an…
Economics
ISBN:
9781305506381
Author:
James R. McGuigan, R. Charles Moyer, Frederick H.deB. Harris
Publisher:
Cengage Learning
Principles of Economics 2e
Economics
ISBN:
9781947172364
Author:
Steven A. Greenlaw; David Shapiro
Publisher:
OpenStax
Managerial Economics: Applications, Strategies an…
Economics
ISBN:
9781305506381
Author:
James R. McGuigan, R. Charles Moyer, Frederick H.deB. Harris
Publisher:
Cengage Learning