7. Using tables to calculate probabilities from the normal distribution Use the following unit normal tables and accompanying figures to determine the probability that a z-score value will fall within each of the specified ranges. To use the tables, click on the Unit Normal Tables tab beneath the figures, and use the dropdown box to select the desired range of z-score values. A table of the proportions of the normal distribution corresponding to that range of z-scores will appear. If you need a different range of z- scores, simply click on the box again and select a new range. Suggestion: For each of the following five questions, make a sketch of the area under the normal distribution you are seeking. This sketch will help you determine which column(s) of the unit normal tables to use in determining the appropriate probability. 1. p(z > 2.5) 2. p(z > -0.6) 3. p(z < 3.8) 4. p(0.5 < z < 1.5) 5. (-1.4< z< 2.6) %3D D: Between 0 and z Body B. Tall C 0.00 szs0.24 0.25 szs0.49 0.50 szs0.74 0.75 szs0.99 1.00 szs1.24 1.25 szs1.49 1.50 szs 1.74 1.75 szs1.99
7. Using tables to calculate probabilities from the normal distribution Use the following unit normal tables and accompanying figures to determine the probability that a z-score value will fall within each of the specified ranges. To use the tables, click on the Unit Normal Tables tab beneath the figures, and use the dropdown box to select the desired range of z-score values. A table of the proportions of the normal distribution corresponding to that range of z-scores will appear. If you need a different range of z- scores, simply click on the box again and select a new range. Suggestion: For each of the following five questions, make a sketch of the area under the normal distribution you are seeking. This sketch will help you determine which column(s) of the unit normal tables to use in determining the appropriate probability. 1. p(z > 2.5) 2. p(z > -0.6) 3. p(z < 3.8) 4. p(0.5 < z < 1.5) 5. (-1.4< z< 2.6) %3D D: Between 0 and z Body B. Tall C 0.00 szs0.24 0.25 szs0.49 0.50 szs0.74 0.75 szs0.99 1.00 szs1.24 1.25 szs1.49 1.50 szs 1.74 1.75 szs1.99

MATLAB: An Introduction with Applications
6th Edition
ISBN:9781119256830
Author:Amos Gilat
Publisher:Amos Gilat
Chapter1: Starting With Matlab
Section: Chapter Questions
Problem 1P

Related questions
Question
Please help with all parts of this homework question
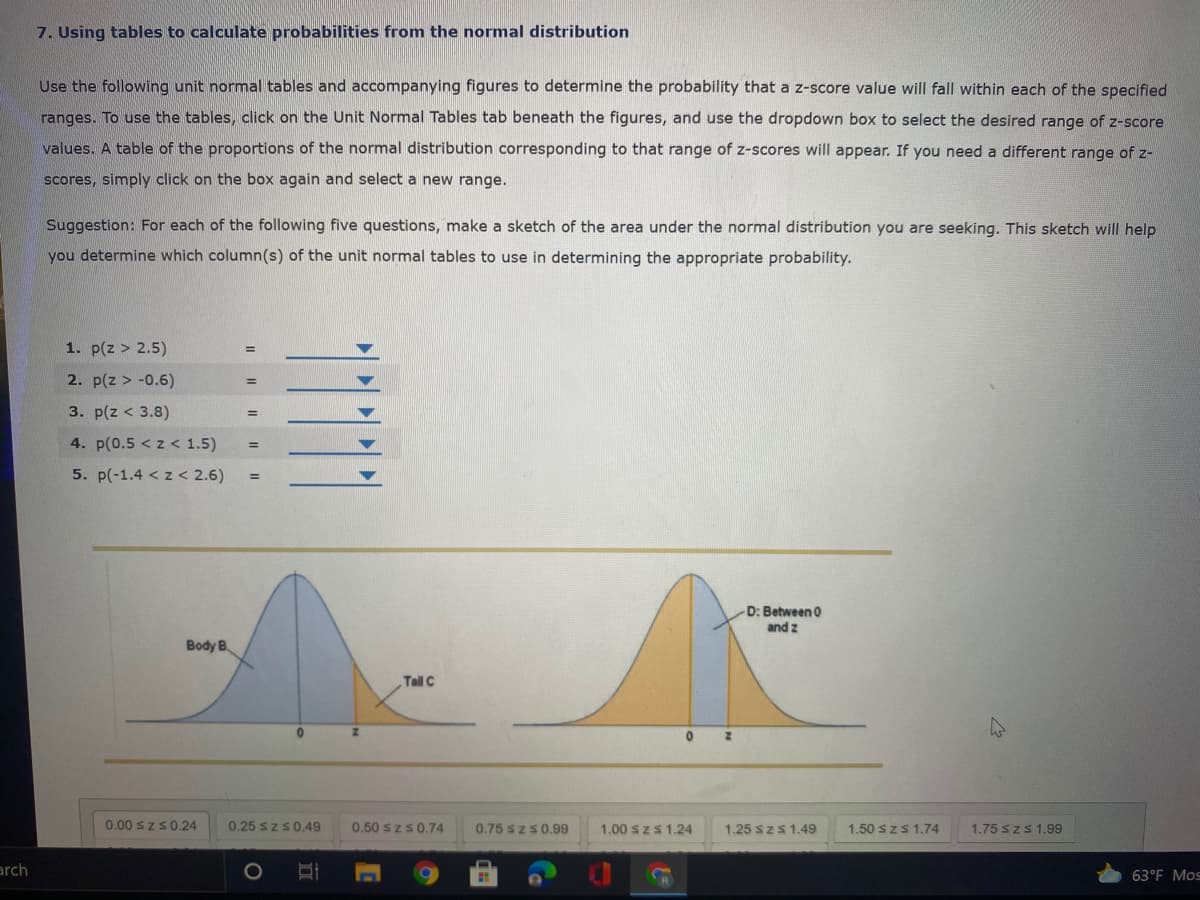
Transcribed Image Text:7. Using tables to calculate probabilities from the normal distribution
Use the following unit normal tables and accompanying figures to determine the probability that a z-score value will fall within each of the specified
ranges. To use the tables, click on the Unit Normal Tables tab beneath the figures, and use the dropdown box to select the desired range of z-score
values. A table of the proportions of the normal distribution corresponding to that range of z-scores will appear. If you need a different range of z-
scores, simply click on the box again and select a new range.
Suggestion: For each of the following five questions, make a sketch of the area under the normal distribution you are seeking. This sketch will help
you determine which column(s) of the unit normal tables to use in determining the appropriate probability.
1. p(z > 2.5)
2. p(z > -0.6)
3. p(z < 3.8)
4. p(0.5 < z < 1.5)
5. p(-1.4 < z < 2.6)
D: Between 0
and z
Body B.
Tail C
0.00 szs0.24
0.25 szs0.49
0.50 szs0.74
0.75 szs0.99
1.00 szs 1.24
1.25 szs1.49
1.50 szs 1.74
1.75 szs 1.99
arch
63°F Mos
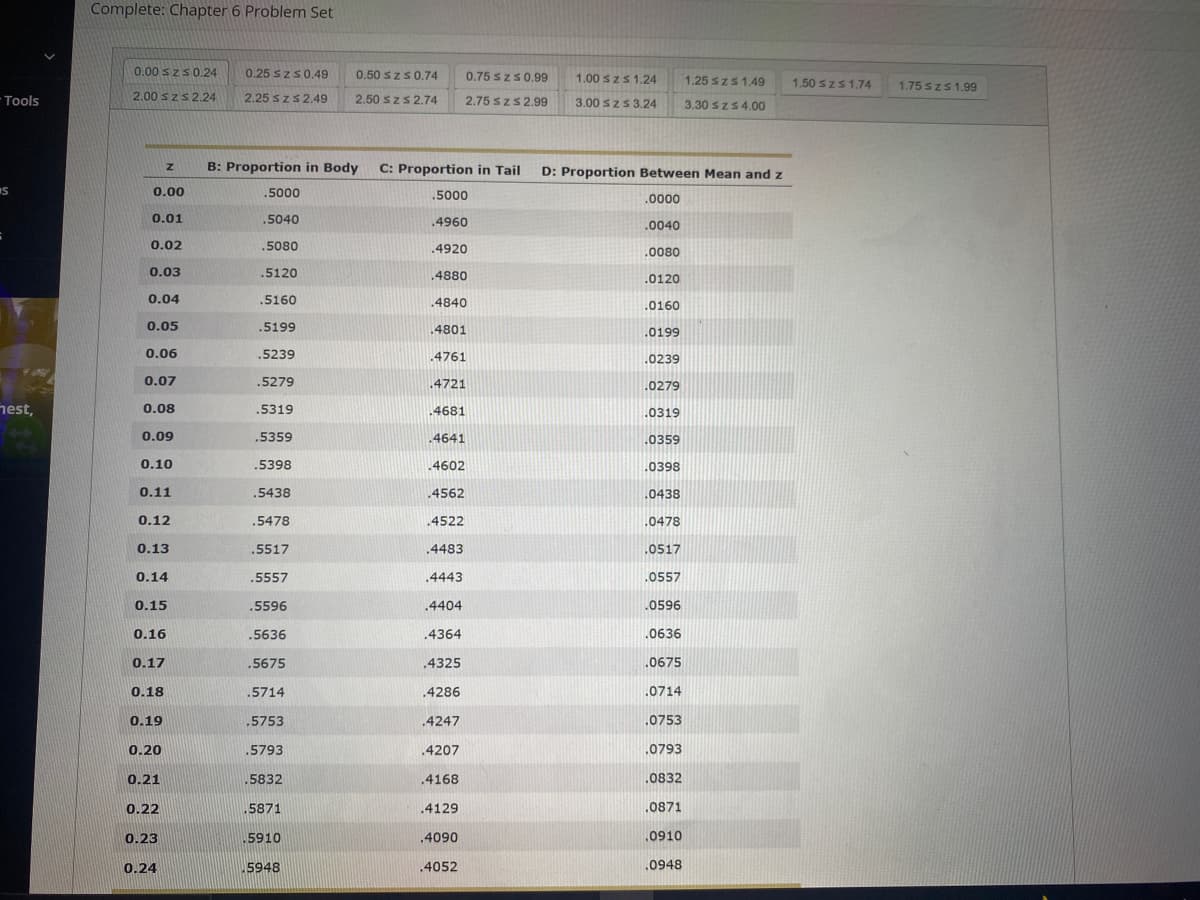
Transcribed Image Text:Complete: Chapter 6 Problem Set
0.00 szs0.24
0.25 szs0.49
0.50 szs0,74
0.75 szs0.99
1.00 szs 1.24
1.25 szs 1.49
1.50 szs 1.74
1.75 szs1,99
Tools
2.00 szs 2.24
2.25 szs2,49
2.50 szs 2.74
2.75 szs 2.99
3.00 szs 3.24
3.30 szs4.00
B: Proportion in Body
C: Proportion in Tail
D: Proportion Between Mean and z
0.00
.5000
.5000
.0000
0.01
.5040
.4960
.0040
0.02
.5080
.4920
.0080
0.03
.5120
.4880
.0120
0.04
.5160
.4840
.0160
0.05
.5199
4801
.0199
0.06
.5239
.4761
.0239
0.07
.5279
4721
.0279
nest,
0.08
.5319
.4681
.0319
0.09
.5359
.4641
.0359
0.10
.5398
4602
.0398
0.11
.5438
4562
.0438
0.12
.5478
.4522
.0478
0.13
.5517
.4483
.0517
0.14
.5557
.4443
.0557
0.15
.5596
.4404
.0596
0.16
.5636
.4364
.0636
0.17
.5675
.4325
.0675
0.18
5714
4286
.0714
0.19
.5753
.4247
.0753
0.20
.5793
.4207
.0793
0.21
.5832
.4168
.0832
0.22
.5871
.4129
.0871
0.23
5910
.4090
.0910
0.24
5948
.4052
.0948
Expert Solution
This question has been solved!
Explore an expertly crafted, step-by-step solution for a thorough understanding of key concepts.

This is a popular solution!

Trending now
This is a popular solution!

Step by step
Solved in 6 steps

Recommended textbooks for you
MATLAB: An Introduction with Applications
Statistics
ISBN:
9781119256830
Author:
Amos Gilat
Publisher:
John Wiley & Sons Inc

Probability and Statistics for Engineering and th…
Statistics
ISBN:
9781305251809
Author:
Jay L. Devore
Publisher:
Cengage Learning

Statistics for The Behavioral Sciences (MindTap C…
Statistics
ISBN:
9781305504912
Author:
Frederick J Gravetter, Larry B. Wallnau
Publisher:
Cengage Learning
MATLAB: An Introduction with Applications
Statistics
ISBN:
9781119256830
Author:
Amos Gilat
Publisher:
John Wiley & Sons Inc
Probability and Statistics for Engineering and th…
Statistics
ISBN:
9781305251809
Author:
Jay L. Devore
Publisher:
Cengage Learning
Statistics for The Behavioral Sciences (MindTap C…
Statistics
ISBN:
9781305504912
Author:
Frederick J Gravetter, Larry B. Wallnau
Publisher:
Cengage Learning

Elementary Statistics: Picturing the World (7th E…
Statistics
ISBN:
9780134683416
Author:
Ron Larson, Betsy Farber
Publisher:
PEARSON

The Basic Practice of Statistics
Statistics
ISBN:
9781319042578
Author:
David S. Moore, William I. Notz, Michael A. Fligner
Publisher:
W. H. Freeman

Introduction to the Practice of Statistics
Statistics
ISBN:
9781319013387
Author:
David S. Moore, George P. McCabe, Bruce A. Craig
Publisher:
W. H. Freeman