7q1r2 defects 2 5 0 1 3 1 3 1 1 1 1 5 0 1 4 1 5 1 4 1 3 1 2 2 2 1 3 1 2 1 0 2 3 1 0 0 2 1 1 1 1 0 6 3 0 A quality control engineer at a particular Icd screen manufacturer is studying the mean number of defects per screen. Based on historical evidence, the mean number of defects per screen was thought to be 2.58. There have recently been changes to the manufacturing process, and the engineer now feels that the mean number of defects per screen may be significantly smaller than 2.58. Using the number of defects on each of 50 sample screens shown below, conduct the appropriate hypothesis test using a 0.1 level of significance. Assignment 7q1 data a) What are the appropriate null and alternative hypotheses? 2.58 versus Ha: u < 2.58 Ho: Но: х = 2.58 versus Ha: x > 2.58 Но: и = 2.58 versus Ha: u # 2.58 Но: и %3D 2.58 versus Ha: И> 2.58 b) What is the test statistic? Give your answer to four decimal places. c) What is the P-value for the test? Give your answer to four decimal places. d) What is the appropriate conclusion? Reject the claim that the mean number of defects per screen is 2.58 because the P-value is larger than 0.1. Fail to reject the claim that the mean number of defects per screen is 2.58 because the P-value is larger than 0.1. Reject the claim that the mean number of defects per screen is 2.58 because the P-value is smaller than 0.1. Fail to reject the claim that the mean number of defects per screen is 2.58 because the P-value is smaller than 0.1
7q1r2 defects 2 5 0 1 3 1 3 1 1 1 1 5 0 1 4 1 5 1 4 1 3 1 2 2 2 1 3 1 2 1 0 2 3 1 0 0 2 1 1 1 1 0 6 3 0 A quality control engineer at a particular Icd screen manufacturer is studying the mean number of defects per screen. Based on historical evidence, the mean number of defects per screen was thought to be 2.58. There have recently been changes to the manufacturing process, and the engineer now feels that the mean number of defects per screen may be significantly smaller than 2.58. Using the number of defects on each of 50 sample screens shown below, conduct the appropriate hypothesis test using a 0.1 level of significance. Assignment 7q1 data a) What are the appropriate null and alternative hypotheses? 2.58 versus Ha: u < 2.58 Ho: Но: х = 2.58 versus Ha: x > 2.58 Но: и = 2.58 versus Ha: u # 2.58 Но: и %3D 2.58 versus Ha: И> 2.58 b) What is the test statistic? Give your answer to four decimal places. c) What is the P-value for the test? Give your answer to four decimal places. d) What is the appropriate conclusion? Reject the claim that the mean number of defects per screen is 2.58 because the P-value is larger than 0.1. Fail to reject the claim that the mean number of defects per screen is 2.58 because the P-value is larger than 0.1. Reject the claim that the mean number of defects per screen is 2.58 because the P-value is smaller than 0.1. Fail to reject the claim that the mean number of defects per screen is 2.58 because the P-value is smaller than 0.1

Algebra & Trigonometry with Analytic Geometry
13th Edition
ISBN:9781133382119
Author:Swokowski
Publisher:Swokowski
Chapter10: Sequences, Series, And Probability
Section10.8: Probability
Problem 31E

Related questions
Question

Transcribed Image Text:7q1r2
defects
2
5
0
1
3
1
3
1
1
1
1
5
0
1
4
1
5
1
4
1
3
1
2
2
2
1
3
1
2
1
0
2
3
1
0
0
2
1
1
1
1
0
6
3
0
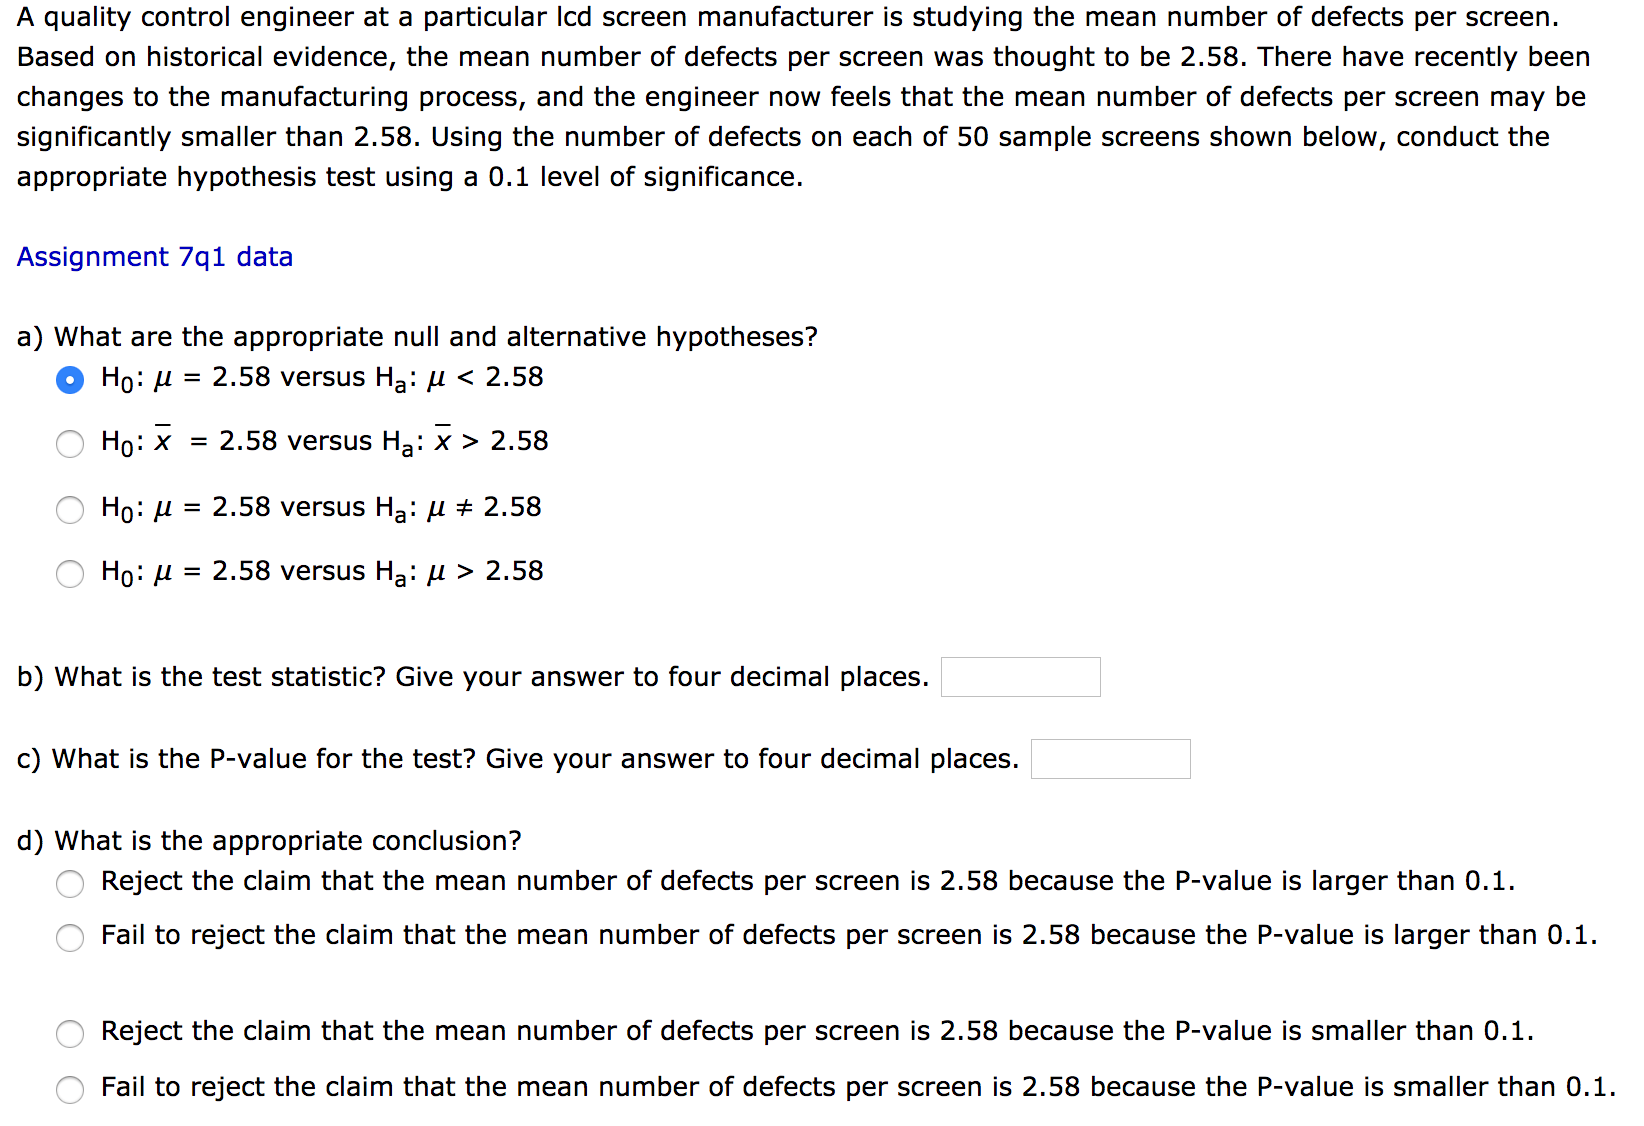
Transcribed Image Text:A quality control engineer at a particular Icd screen manufacturer is studying the mean number of defects per screen.
Based on historical evidence, the mean number of defects per screen was thought to be 2.58. There have recently been
changes to the manufacturing process, and the engineer now feels that the mean number of defects per screen may be
significantly smaller than 2.58. Using the number of defects on each of 50 sample screens shown below, conduct the
appropriate hypothesis test using a 0.1 level of significance.
Assignment 7q1 data
a) What are the appropriate null and alternative hypotheses?
2.58 versus Ha: u < 2.58
Ho:
Но: х
= 2.58 versus Ha: x > 2.58
Но: и
= 2.58 versus Ha: u # 2.58
Но: и %3D 2.58 versus Ha: И> 2.58
b) What is the test statistic? Give your answer to four decimal places.
c) What is the P-value for the test? Give your answer to four decimal places.
d) What is the appropriate conclusion?
Reject the claim that the mean number of defects per screen is 2.58 because the P-value is larger than 0.1.
Fail to reject the claim that the mean number of defects per screen is 2.58 because the P-value is larger than 0.1.
Reject the claim that the mean number of defects per screen is 2.58 because the P-value is smaller than 0.1.
Fail to reject the claim that the mean number of defects per screen is 2.58 because the P-value is smaller than 0.1
Expert Solution
This question has been solved!
Explore an expertly crafted, step-by-step solution for a thorough understanding of key concepts.

This is a popular solution!

Trending now
This is a popular solution!

Step by step
Solved in 3 steps with 1 images

Recommended textbooks for you
Algebra & Trigonometry with Analytic Geometry
Algebra
ISBN:
9781133382119
Author:
Swokowski
Publisher:
Cengage
Algebra & Trigonometry with Analytic Geometry
Algebra
ISBN:
9781133382119
Author:
Swokowski
Publisher:
Cengage