8. What is the constant rate of change shown in the graph below? * Picnic 18 123456789 Number of People. 2.5 O 7.5 O 10 Pounds of Meat 으64208642 o
8. What is the constant rate of change shown in the graph below? * Picnic 18 123456789 Number of People. 2.5 O 7.5 O 10 Pounds of Meat 으64208642 o

Chapter3: Functions
Section3.3: Rates Of Change And Behavior Of Graphs
Problem 1SE: Can the average rate of change of a function be constant?

Related questions

Topic Video
Question
100%
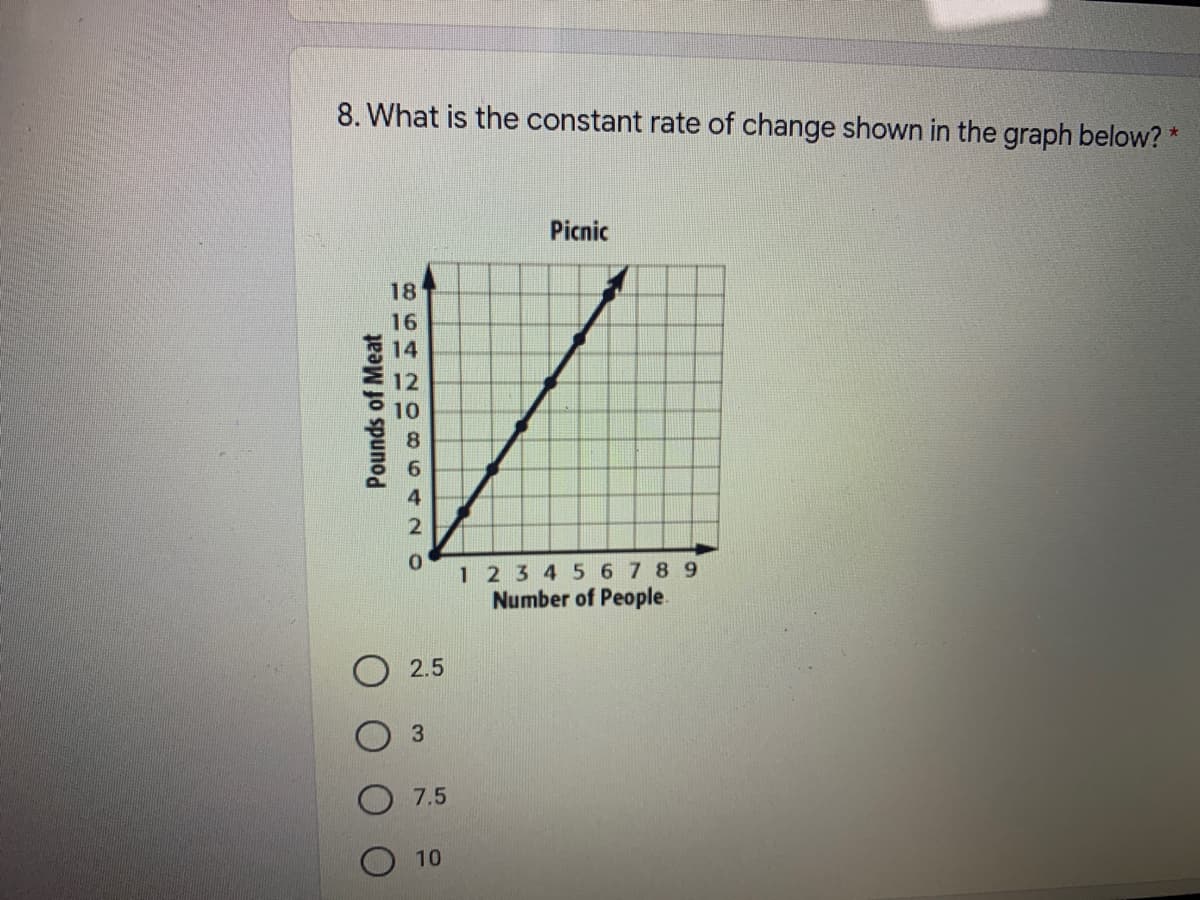
Transcribed Image Text:8. What is the constant rate of change shown in the graph below? *
Picnic
18
14
10
1 234567 8 9
Number of People.
2.5
7.5
10
Pounds of Meat
---
Expert Solution
Step 1
In the graph
Constant rate of change?
Constant rate of change of this graph is called slop.

Trending now
This is a popular solution!

Step by step
Solved in 2 steps

Knowledge Booster


Learn more about
Need a deep-dive on the concept behind this application? Look no further. Learn more about this topic, algebra and related others by exploring similar questions and additional content below.Recommended textbooks for you

Trigonometry (MindTap Course List)
Trigonometry
ISBN:
9781337278461
Author:
Ron Larson
Publisher:
Cengage Learning

College Algebra
Algebra
ISBN:
9781305115545
Author:
James Stewart, Lothar Redlin, Saleem Watson
Publisher:
Cengage Learning
Trigonometry (MindTap Course List)
Trigonometry
ISBN:
9781337278461
Author:
Ron Larson
Publisher:
Cengage Learning
College Algebra
Algebra
ISBN:
9781305115545
Author:
James Stewart, Lothar Redlin, Saleem Watson
Publisher:
Cengage Learning

Big Ideas Math A Bridge To Success Algebra 1: Stu…
Algebra
ISBN:
9781680331141
Author:
HOUGHTON MIFFLIN HARCOURT
Publisher:
Houghton Mifflin Harcourt

Functions and Change: A Modeling Approach to Coll…
Algebra
ISBN:
9781337111348
Author:
Bruce Crauder, Benny Evans, Alan Noell
Publisher:
Cengage Learning