877 Stargel Inc. Comparative Income Statement For the Years Ended December 31, 20Y2 and 20Y1 20Y2 $10,000,000 20Υ1 Sales.... ** Cost of goods sold. Gross profit. Selling expenses Administrative expenses. 5,350,000 $ 4,650,000 $ 2,000,000 $9,400,000 4,950,000 $4,450,000 $1,880,000 Total operating expenses Income from operations Other revenue.... 1,500,000 $ 3,500,000 $ 1,150,000 1,410,000 $3,290,000 $1,160,000 150,000 $ 1,300,000 140,000 $1,300.000 Other expense (interest) Income before income tax Income tax expense.... 170,000 $ 1,130,000 150.000 $1,150,000 230,000 225,000 Net income $ 900,000 $ 925,000 Stargel Inc. Comparative Balance Sheet December 31, 20Y2 and 20Y1 20Y2 20Υ1 Assets Current assets: Cash Marketable securities $ 500,000 $ 400,000 1,010,000 1,000,000 Accounts receivable (net). 510,000 950,000 740,000 1,190,000 P...... Prepaid expenses... 250,000 229,000 Total current assets.. $3,690,000 $3,089,000 Long-term investments...... Property, plant, and equipment (net) Total assets 2,350,000 2,300,000 3,740,000 3,366,000 $9,780,000 $8.755,000 Liabilities Current liabilities. $ 900,000 $ 880,000 Long-term liabilities: Mortgage note payable, 10%.. Bonds payable, 10%.... Total long-term liabilities Total liabilities... $ 200,000 %2. 1,500,000 $1,700,000 1,500,000 $1,500,000 $2,380,000 $2,600,000 Stockholders' Equity Preferred S0.90 stock, $10 par Common stock, $5 par. $ 500,000 $ 500,000 ...... 500,000 500,000 Retained earnings Total stockholders' equity 6,180,000 5,375,000 $7,180,000 $6,375,000 $8,755,000 Total liabilities and stockholders'equity. $9,780,000 Instructions Determine the following measures for 20Y2, rounding to one decimal place including percentages, except for per-share amounts: e e an The comparative financial statements of Stargel Inc. are as follows. The market price of Stargel common stock was $119.70 on December 31, 20Y2. PR 17-4B Measures of liquidity, solvency and profitability Foromparative Retained E e Years Ended December 31, 20Y2 and 20Y1 Stargel Incngs Statement Retained earnings, January 1 Net income Total.......... Dividends: Preferred stock dividends. Common stock dividends Total dividends... . . Retained earnings, December 31
877 Stargel Inc. Comparative Income Statement For the Years Ended December 31, 20Y2 and 20Y1 20Y2 $10,000,000 20Υ1 Sales.... ** Cost of goods sold. Gross profit. Selling expenses Administrative expenses. 5,350,000 $ 4,650,000 $ 2,000,000 $9,400,000 4,950,000 $4,450,000 $1,880,000 Total operating expenses Income from operations Other revenue.... 1,500,000 $ 3,500,000 $ 1,150,000 1,410,000 $3,290,000 $1,160,000 150,000 $ 1,300,000 140,000 $1,300.000 Other expense (interest) Income before income tax Income tax expense.... 170,000 $ 1,130,000 150.000 $1,150,000 230,000 225,000 Net income $ 900,000 $ 925,000 Stargel Inc. Comparative Balance Sheet December 31, 20Y2 and 20Y1 20Y2 20Υ1 Assets Current assets: Cash Marketable securities $ 500,000 $ 400,000 1,010,000 1,000,000 Accounts receivable (net). 510,000 950,000 740,000 1,190,000 P...... Prepaid expenses... 250,000 229,000 Total current assets.. $3,690,000 $3,089,000 Long-term investments...... Property, plant, and equipment (net) Total assets 2,350,000 2,300,000 3,740,000 3,366,000 $9,780,000 $8.755,000 Liabilities Current liabilities. $ 900,000 $ 880,000 Long-term liabilities: Mortgage note payable, 10%.. Bonds payable, 10%.... Total long-term liabilities Total liabilities... $ 200,000 %2. 1,500,000 $1,700,000 1,500,000 $1,500,000 $2,380,000 $2,600,000 Stockholders' Equity Preferred S0.90 stock, $10 par Common stock, $5 par. $ 500,000 $ 500,000 ...... 500,000 500,000 Retained earnings Total stockholders' equity 6,180,000 5,375,000 $7,180,000 $6,375,000 $8,755,000 Total liabilities and stockholders'equity. $9,780,000 Instructions Determine the following measures for 20Y2, rounding to one decimal place including percentages, except for per-share amounts: e e an The comparative financial statements of Stargel Inc. are as follows. The market price of Stargel common stock was $119.70 on December 31, 20Y2. PR 17-4B Measures of liquidity, solvency and profitability Foromparative Retained E e Years Ended December 31, 20Y2 and 20Y1 Stargel Incngs Statement Retained earnings, January 1 Net income Total.......... Dividends: Preferred stock dividends. Common stock dividends Total dividends... . . Retained earnings, December 31

Intermediate Accounting: Reporting And Analysis
3rd Edition
ISBN:9781337788281
Author:James M. Wahlen, Jefferson P. Jones, Donald Pagach
Publisher:James M. Wahlen, Jefferson P. Jones, Donald Pagach
Chapter5: The Income Statement And The Statement Of Cash Flows
Section: Chapter Questions
Problem 1RE: Brandt Corporation had sales revenue of 500,000 for the current year. For the year, its cost of...

Related questions

Question
100%
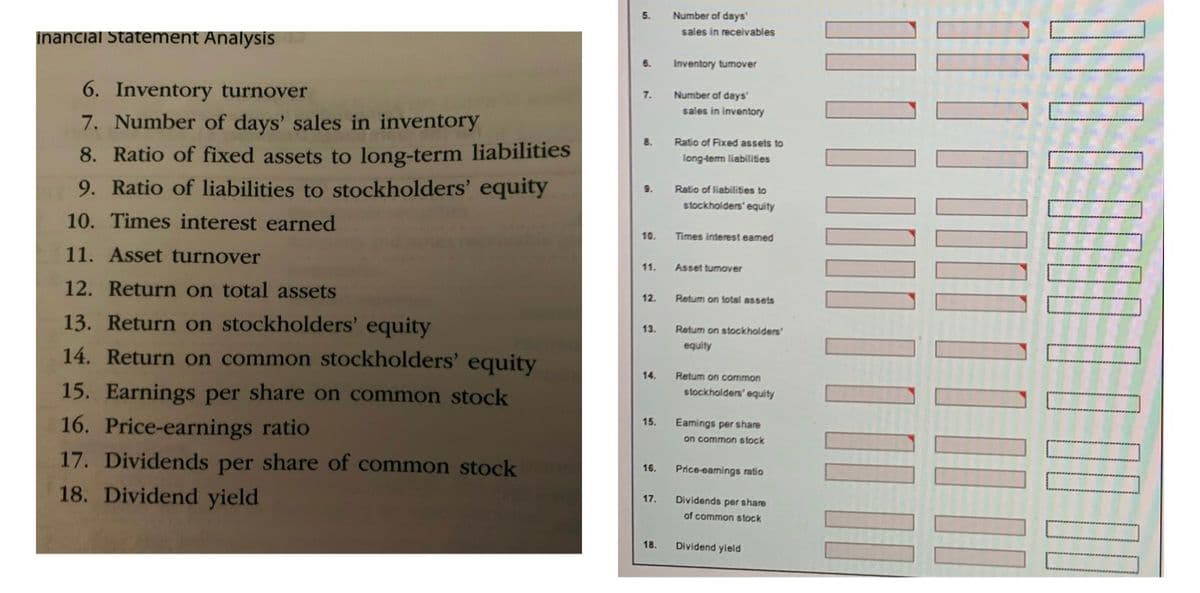
Can you help me with #5- #18
Transcribed Image Text:Number of days"
sales in receivables
5.
inancial Statement Analysis
6.
Inventory tumover
6. Inventory turnover
Number of days"
sales in inventory
7.
7. Number of days' sales in inventory
8. Ratio of fixed assets to long-term liabilities
9. Ratio of liabilities to stockholders' equity
8.
Ratio of Fixed assets to
long-tem liabilities
9.
Ratio of liabilities to
stockholders' equity
10. Times interest earned
10.
Times interest eamed
11. Asset turnover
11.
Asset tumover
12. Return on total assets
12.
Retum on total assets
13. Return on stockholders' equity
Retum on stockholders
13.
equity
14. Return on common stockholders' equity
14.
Retum on common
15. Earnings per share on common stock
stockholders' equity
16. Price-earnings ratio
17. Dividends per share of common stock
15.
Eamings per share
on common stock
16.
Price eamings ratio
18. Dividend yield
17.
Dividends per share
of common stock
18.
Dividend yield
Transcribed Image Text:For the Years Ended December 31, 20Y2 and 20Y1
aiysis
877
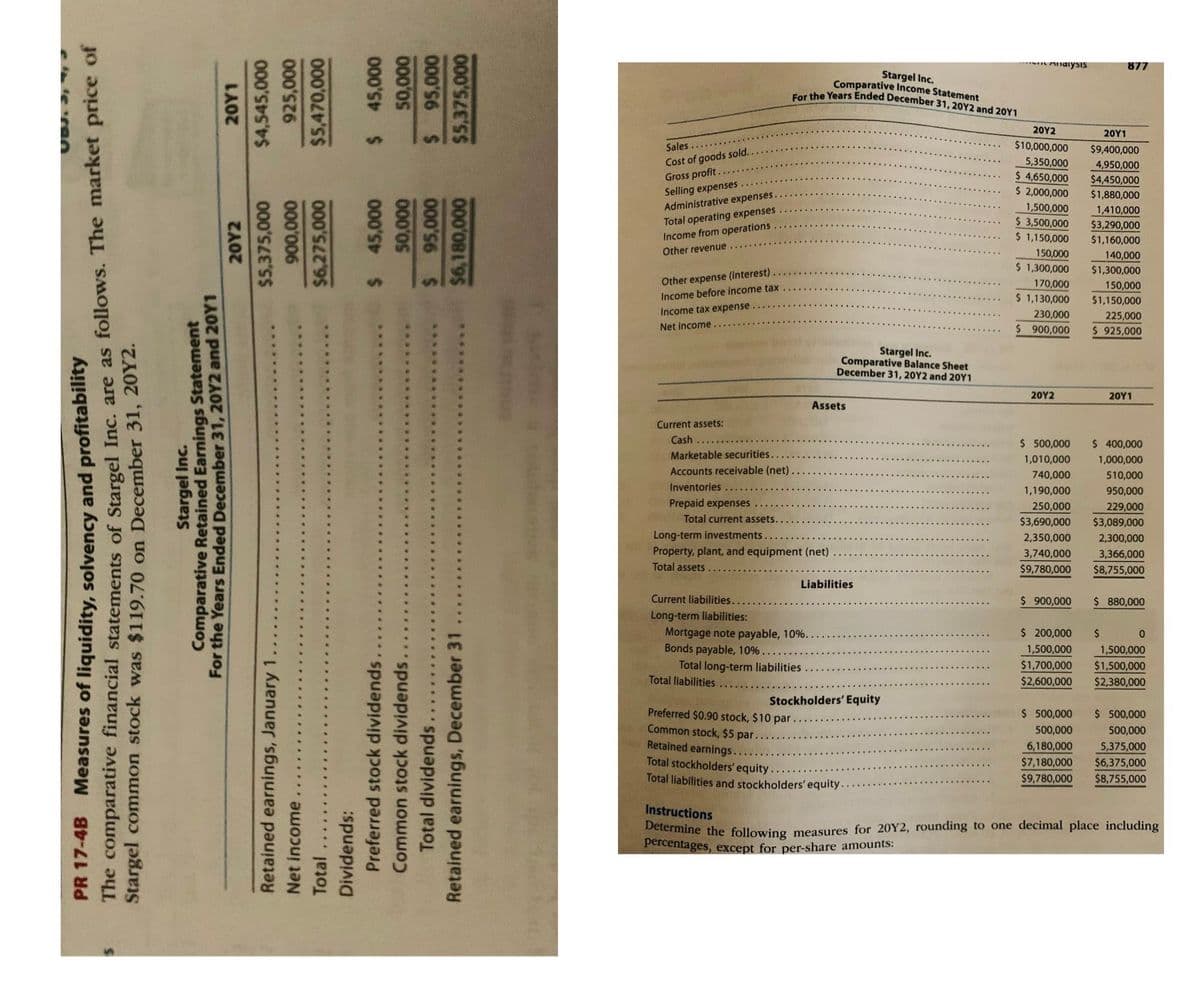
Stargel Inc.
Comparative Income Statement
for the Years Ended December 31, 20Y2 and 20Y1
20Υ2
20Υ1
Sales...*
$10,000,000
$9,400,000
Cost of goods sold.
Gross profit
Selling expenses...
Administrative expenses.
Total operating expenses
Income from operations.
Other revenue....
5,350,000
4,950,000
$ 4,650,000
$ 2,000,000
$4,450,000
$1,880,000
1,500,000
$ 3,500,000
$ 1,150,000
1,410,000
$3,290,000
$1,160,000
150,000
140,000
$ 1,300,000
$1,300,000
Other expense (interest)
Income before income tax
Income tax expense.
170,000
$ 1,130,000
150,000
$1,150,000
230.000
225,000
Net income
$ 900,000
24925,000
Stargel Inc.
Comparative Balance Sheet
December 31, 20Y2 and 20Y1
20Υ2
20Υ1
Assets
Current assets:
Cash
$ 500,000
$ 400,000
Marketable securities..
1,010,000
1,000,000
Accounts receivable (net)
740,000
510,000
Inventories
1,190,000
950,000
Prepaid expenses
250,000
229,000
$3,089,000
Total current assets..
$3,690,000
Long-term investments
Property, plant, and equipment (net)
Total assets.
2,350,000
2,300,000
3,740,000
3,366,000
$9,780,000
$8,755,000
Liabilities
Current liabilities.
$ 900,000
$ 880,000
Long-term liabilities:
Mortgage note payable, 10%.
Bonds payable, 10%....
$ 200,000
1,500,000
1,500,000
$1,500,000
Total long-term liabilities
Total liabilities........
$1,700,000
$2,600,000
$2,380,000
Stockholders' Equity
$ 500,000
Preferred $0.90 stock, $10 par
Common stock, $5 par.
$ 500,000
500,000
500,000
Retained earnings.
6,180,000
$7,180,000
5,375,000
Total stockholders' equity...
Total liabilities and stockholders' equity
$6,375,000
$9,780,000
$8,755,000
Instructions
Determine the following measures for 20Y2, rounding to one decimal place including
percentages, except for per-share amounts:
PR 17-4B Measures of liquidity, solvency and profitability
The comparative financial statements of Stargel Inc. are as follows. The market price of
Stargel common stock was $119.70 on December 31, 20Y2.
Stargel Inc.
Comparative Retained Earnings Statement
For the Years Ended December 31, 20Y2 and 20Y1
Retained earnings, January
Net income
Total
Dividends:
Preferred stock dividends
Common stock dividends.
Total dividends.
Retained earnings, December 31
Expert Solution
This question has been solved!
Explore an expertly crafted, step-by-step solution for a thorough understanding of key concepts.

This is a popular solution!

Trending now
This is a popular solution!

Step by step
Solved in 2 steps

Knowledge Booster


Learn more about
Need a deep-dive on the concept behind this application? Look no further. Learn more about this topic, accounting and related others by exploring similar questions and additional content below.Recommended textbooks for you
Intermediate Accounting: Reporting And Analysis
Accounting
ISBN:
9781337788281
Author:
James M. Wahlen, Jefferson P. Jones, Donald Pagach
Publisher:
Cengage Learning


Managerial Accounting: The Cornerstone of Busines…
Accounting
ISBN:
9781337115773
Author:
Maryanne M. Mowen, Don R. Hansen, Dan L. Heitger
Publisher:
Cengage Learning
Intermediate Accounting: Reporting And Analysis
Accounting
ISBN:
9781337788281
Author:
James M. Wahlen, Jefferson P. Jones, Donald Pagach
Publisher:
Cengage Learning
Managerial Accounting: The Cornerstone of Busines…
Accounting
ISBN:
9781337115773
Author:
Maryanne M. Mowen, Don R. Hansen, Dan L. Heitger
Publisher:
Cengage Learning

Survey of Accounting (Accounting I)
Accounting
ISBN:
9781305961883
Author:
Carl Warren
Publisher:
Cengage Learning
Century 21 Accounting Multicolumn Journal
Accounting
ISBN:
9781337679503
Author:
Gilbertson
Publisher:
Cengage