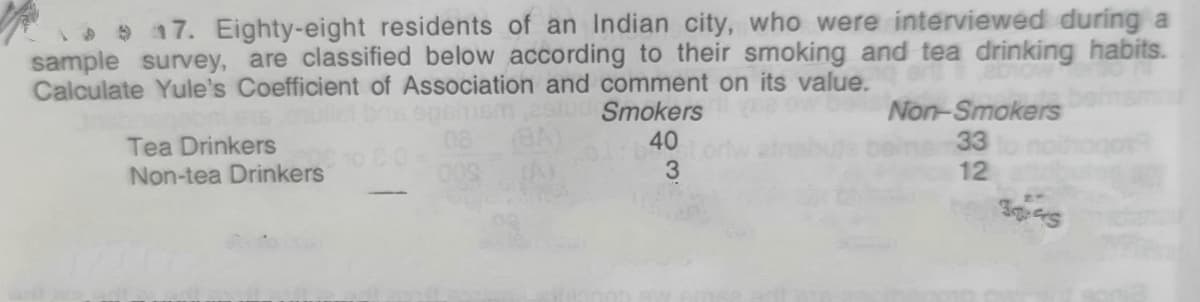
9 17. Eighty-eight residents of an Indian city, who were interviewed during a sample survey, are classified below according to their smoking and tea drinking habits. Calculate Yule's Coefficient of Association and comment on its value.


Q: Q.7: Mr. Hamood. a research scholar of Business Department in HCT, would like to find out the…
A: Hi! Thank you for the question! Since the question contains four subparts and we are allowed to…
Q: Married Unmarried Passed 90 260 Failed 65 110 Total 155 370 Calculate Yule's Coefficient of…
A: Given that 2×2 contingency table Passed Failed Total Married 90 65 155 Unmarried 260…
Q: Send data to Excel Length of smoking cessation period Between Less than two weeks At least one Total…
A: We complete the given data table from the given formula. Expected frequency= row total* column…
Q: Is there a relation between murder and arson? A random sample of 15 Midwest cities (over 10,000…
A: The given information about the random sample of 15 Midwest cities annual number of murder and arson…
Q: A report stated that based on observing a large number of vehicle occupants, the estimated…
A:
Q: Is there a relation between murder and arson? A random sample of 15 Midwest cities (over 10,000…
A: (a).Spearman’s coefficient of rank correlation:
Q: Golden Retriever German Short Hair Pointer 3 Begian Tervuren 1 Australian Shepherd 3 Border Collie 1…
A: Given data and calculation of relative frequency is shown in the table
Q: The null hypothesis always include that the possibility that the groups you are comparing are? A)…
A: P
Q: As part of a study on transportation safety, the U.S. Department of Transportation collected data on…
A: Hello! As you have posted more than 3 sub parts, we are answering the first 3 sub-parts. In case…
Q: 7. A researcher observes and records the behaviors of children on the playground before lunch and…
A: A researcher observes and records the behaviors of children on the playground before lunch and after…
Q: given (0,4) (2,9) (1,6) and (1,9) compute the Pearson Correlation.
A: Calculation: From the table, the summary of quantities are,
Q: The following table shows the profile of patients inflicted by the pandemic disease. Create a…
A: Relative frequency table: PHStat Procedure: In EXCEL, Select Add-Ins > PHStat > Descriptive…
Q: 2. Consider the following data, Method 1 Method 2 Method 3 1,09 1,74 1,92 1,47 2,31 1,97 1,70 1,90…
A: since there are multiple parts , first part is answered in detail. kindly repost for more help .
Q: The authors of a paper concerned about racial stereotypes in television counted the number of times…
A: We have to test that if proportions are changed since last census for that we will use goodness of…
Q: 9.14. CJ The mayor of a large city started a crimeline" program some years ago and wonders whether…
A: Proportion is almost similar to the concept of probability. Proportion is a fraction of population…
Q: 13 association bet ween the tempers of brothers and Do you find sisters from the following data: any…
A:
Q: 21. The frequency distribution representing the number of frequent flier miles accumulated by…
A: Frequency distribution is a recorded series of values with counts of either categorized observation…
Q: What significance test can be used to assess whether there is a relationship between receiving an…
A: Chi-square test is used to test relationship between two categorical variables. Receiving an…
Q: 2. The manager of the police department motor pool wants to develop a forecast model for annual…
A: Hi! Thank you for the question, As per the honor code, we are allowed to answer three sub-parts at a…
Q: 2) An Industrial/Organizational Psychologist plans a study on cortisol levels (a measure of stress)…
A: T test are usually used to compare estimates about population mean 1. Independent T test for single…
Q: Complete the following table using the sample of 10 IQ scores. Xi Xi - (Xi - )2 91 93 103…
A: X bar = (summation Xi)/n Then we find (Xi-X bar )2 We know that, SS=summation (Xi-X bar)2 S2=…
Q: A study was conducted to determine the proportion of people who dream in black and white instead of…
A: Hello! As you have posted more than 3 sub parts, we are answering the first 3 sub-parts. In case…
Q: 2 22.11. In a report on consumer preference, it was given that out of 500 persons surveyed, 400…
A:
Q: In Exercises 5–12, identify whether the given value is a statistic or a parameter. Titanic A study…
A: Given that,All 2,223 passengers aboard the Titanic were surveyed, when it sank.
Q: Calculate Yule's Coefficient of Association between marriage and failure of students from the…
A:
Q: 10.24 The question of whether the sexual orientation of the mother has an impact on the sexual…
A: a) The populations of interest in this study is lesbian mothers and heterosexual single mothers.
Q: sample of 180 hypertension NON MODERATE HEAVY…
A: Given Information: 1) 2)
Q: Q.7: Mr. Hamood, a research scholar of Business Department in HCT, would like to find out the…
A: 1. In this case, it is appropriate to collect the data by randomly choosing the student of different…
Q: 1. A student wants to determine the current income of students at her college. Which of the…
A: Here given student wants to determine the current income of student at her college
Q: Eighty-eight residents of an American city, who were interviewed during a sample survey are…
A:
Q: As part of a study on transportation safety, the U.S. Department of Transportation collected data on…
A:
Q: 2. Compute and interpret the sample correlation for the following dataset. Yi 4 50 11 40 3 60 16 30
A: The given data are xi yi xi*yi xi2 yi2 4 50 200 16 2500 11 40 440 121 1600 3 60 180 9 3600…
Q: The survey on student attitude toward e-books described in Exercise 3.5 was conducted in 2011. A…
A: Bar chart is an ideal way of visually representing categorical data.
Q: 10.6 Cable TV subscriptions and "cord cutters." Refer to the Pew Research Center Survey (December…
A: From given data There are 2001 adults living in the united states
Q: 10.46 Social scientists have produced convincing evidence that parental divorce is negatively…
A: a) Construct the side by side plot for the students who graduate from high school are different…
Q: Which statistical test needs to be used to interpret these data groups? a. Age OCD began / age…
A: Since you have posted a question with multiple subparts, we will solve first three subparts for you.…
Q: 1- The number of semester credit hours for seven part-time college students i 8, 5, 4, 10, 8, 3, and…
A: Given data is appropriate for measures of central tendency. Arithmetic mean is nothing but it is…
Q: 3.24: The data in the accompanying table are from the Organization for Economic Co-operation and…
A: The given data set is: 49.30 39.70 60.60 28.10 28.90 32.60 45.90 41.10 44.0…
Q: 10.26 An independent-samples t test, "all inclusive" resorts, and alcohol consumption: At some…
A: given that
Q: Example 3. A survey company investigated 800 car owners and found, 65- owned Maruti car and 300…
A:
Q: 4.58 How many different ways can a senior project manager and an associate project manager be…
A: Given, no.of data scientists =8
Q: 17. A company is interested in evaluating its current inspection procedure on shipments of 50…
A:
Q: 9. The number of stories in the 13 tallest buildings for two different cities is listed below. Which…
A: For comparing variability, uniformity, and consistency of two variables we calculation the…
Q: 4. The following table shows the opinions of a random sample of students classified according to sex…
A: There are two categorical variables which are opinion and sex. We have to test whether there is a…
Q: 2. An investor in the telecommunications industry has been provided with some questionable…
A: The following data is given, Average monthly data usage(GB) 100 110 120 130 140 150 160 160 170…
Q: : 22.24. In a co-education institution, out of 200 students, 150 were boys. In an examinations, 120…
A: Here, N = 200A: BoysB: passed in the exam
Q: 5. (10) A recent Gallup Organization Poll asked male and female Americans whether they were pro or…
A: Given: The data given is as follows Opinion Pro life Pro choice Gender Men 195 200…
Q: 4. The following table shows the opinions of a random sample of students classified according to sex…
A:
Q: 16. What if there was a smaller difference between the two groups? That is, if M, = 14 and M2 = 12.…
A: It is given that M1 = 14, M2 = 12 n1 = 14, n2 = 28 Pooled variance = 14

Step by step
Solved in 2 steps with 1 images

- Calculate F statistic for the following. If SSB = 15.62 (dfb =4) and SSW = 6.39 (dfw = 16)Lin Chi-Ling works for an insurance company and is studying the relationship between types of crashes and the vehicles involved in passenger vehicle occupant deaths. As part of your study, you randomly select 4270 vehicle crashes and organize the resulting data as shown in the contingency table. At α = 0.05 can you conclude that the type of crash depends on the type of vehicle? Vehicle Type of crash Car Pickup Sport utility Single-vehicle 1237 547 479 Multiple-vehicle 1453 307 247 What is the Chi-square test statistics and the decision for this question. The Test statistics is . Leave answers in 3 decimal places. DECISION: We the null hypothesis.A researcher wishes to see if there is a difference between men and women in the number of cases of mental disorders. She selects a sample of 30 males and 26 females and classifies them according to their mental disorder. The results are shown. At α = 0.10, can the researcher conclude that there is a difference in the types of disorders according to gender? Gender Anxiety Depression Schizophrenia Male 8 12 10 Female 12 9 5
- Suppose we want to estimate the annual high temperatures of the hottest major cities in the United States. Below is data from 12 cities with the average annual temperature taken from 1971 to 2000 City Temperature (Fahrenheit) Phoenix, Arizona 87.2 Miami, Florida 84.3 Orlando, Florida 82.8 Riverside, California 80.9 Austin, Texas 79.8 Houston, Texas 79.7 San Antonio, Texas 80.3 Las Vegas, Nevada 80.1 Jacksonville, Florida 79.3 New Orleans, Louisiana 78.2 Tampa, Florida 81.7 Los Angeles, California 75.2 What's the population for this study? What's the sample for this study?suppose that from a sample of 200,000 new york workers, 32,400 reported traveling more than an hour an day. From this information, statisticians determined that about 16.2% of the workers in the state traveled more than an hou to work every day in 2011. If there were 8,437,512 workers in the entire population, about how many traveled more than an hour to work each day?According to a recent census, 14.9%of all housing units in a certain country are vacant. A county supervisor wonders if her county is different from this. She randomly selects 832 housing units in her county and finds that 160 of the housing units are vacant. Complete parts a through d below. What is the P-value=???
- 10.46 Social scientists have produced convincing evidence that parental divorce is negatively associated with the educational success of their children. The paper “Maternal Cohabitation and Educational Success” [Sociology of Education (2005) 78:144–164] describes a study thataddresses the impact of cohabiting mothers on the success of their children in graduating from high school. The following table displays the educational outcome by type of family for 1,168 children.a. Display the above data in a graph to demonstrate any differences in the proportions of high school graduates across family types.b. Is there significant evidence that the proportions of students who graduate from high school are different across the various family types?13/14 The coefficient of determination of the expanded data set is =_%. Round to one decimal place as needed. The coefficient of determination of the expanded data set is =_%. Round to one decimal place as needed. Is the point corresponding to the 12th Car influential? Is it an outlier?The following table is based on information from the U.S. Census Bureau regarding the type of health insurance coverage of people by age in the year 2006: Find P(P or D)
- Suppose the average monthly residential natural gas bill in a certain town is $67.95. How is the average monthly gas bill for a home in this town related to the square footage, number of rooms, and age of the home? The following tables shows the average monthly gas bill over the past year, square footage, number of rooms, and age for a sample of 20 homes. Average Monthly GasBill for Last Year Age SquareFootage Rooms $70.20 16 2,537 6 $81.33 2 3,457 8 $45.86 27 976 6 $59.21 12 1,713 7 $117.88 16 3,979 10 $55.78 2 1,328 7 $47.01 27 1,251 6 $52.89 4 827 5 $32.90 12 645 4 $67.04 29 2,849 5 $76.76 1 2,372 7 $60.40 26 900 6 $44.07 14 1,386 5 $28.68 20 1,299 4 $62.70 17 1,441 6 $45.37 13 542 4 $38.09 10 2,140 4 $45.31 22 908 6 $52.45 25 1,568 5 $94.11 27 1,140 10 (a) Develop an estimated regression equation that can be used to predict a residence's average monthly gas bill for last year given its age. (Use x1 for age. Round your numerical values…In March 2017, 9,195 men took trips with median duration of 300 seconds, and 2,439 women took trips with median duration of 319 seconds, on New York City's ride sharing program, Citibike. Overall, what was the median duration of all Citibike ride trips that month? A. 304 seconds B. 315 seconds C. 309.5 seconds D. None of these. E. Cannot be determinedSixteen percent of the worlds population is left-handed. A researcher claims that left-handed individuals are more creative than those who aren’t left-handed. In order to support his claim, he takes a sample of 2100 artists and finds that 15% of them are left-handed. Answer the following.
