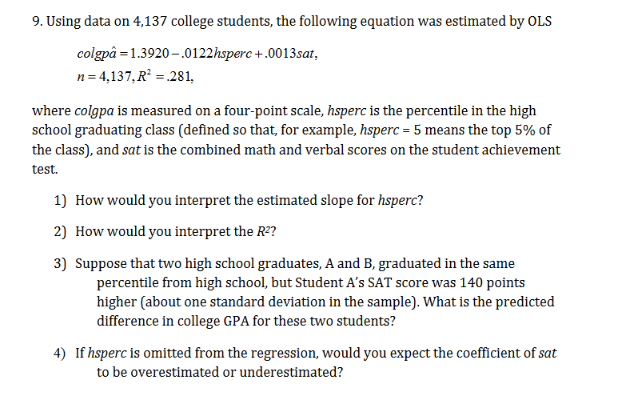
9. Using data on 4,137 college students, the following equation was estimated by OLS colgpå 1.3920-.0122hsperc+.0013sat, n 4,137,R2 281, where colgpa is measured on a four-point scale, hsperc is the percentile in the high school graduating class (defined so that, for example, hsperc =5 means the top 5% of the class), and sat is the combined math and verbal scores on the student achievement test 1) How would you interpret the estimated slope for hsperc? 2) How would you interpret the R2? 3) Suppose that two high school graduates, A and B, graduated in the same percentile from high school, but Student A's SAT score was 140 points higher (about one standard deviation in the sample). What is the predicted difference in college GPA for these two students? 4) If hsperc is omitted from the regression, would you expect the coefficient of sat to be overestimated or underestimated?


Percentage
A percentage is a number indicated as a fraction of 100. It is a dimensionless number often expressed using the symbol %.
Algebraic Expressions
In mathematics, an algebraic expression consists of constant(s), variable(s), and mathematical operators. It is made up of terms.
Numbers
Numbers are some measures used for counting. They can be compared one with another to know its position in the number line and determine which one is greater or lesser than the other.
Subtraction
Before we begin to understand the subtraction of algebraic expressions, we need to list out a few things that form the basis of algebra.
Addition
Before we begin to understand the addition of algebraic expressions, we need to list out a few things that form the basis of algebra.
Part 3 and 4


Trending now
This is a popular solution!

Step by step
Solved in 4 steps with 2 images


