a) Are the estimates ˆa, ˆb, and cˆ statistically significant at the 2 percent level of significance? Which is/are significant and which is/are not? b) Do the results indicate that the average variable cost curve is ∪-shaped? How do you know?  c) If Argus Corporation produces 8,000 vacuum cleaners per month, what is the estimated average variable cost? Marginal cost? Total variable cost? Total cost?  d) Answer part c, assuming that Argus produces 10,000 vacuum cleaners monthly.  e) At what level of output will average variable cost be at a minimum? What is the minimum average variable cost?

ENGR.ECONOMIC ANALYSIS
14th Edition
ISBN:9780190931919
Author:NEWNAN
Publisher:NEWNAN
Chapter1: Making Economics Decisions
Section: Chapter Questions
Problem 1QTC
icon
Related questions
Question

Given: Q = -0.0250 L3 + 1.5 L2       

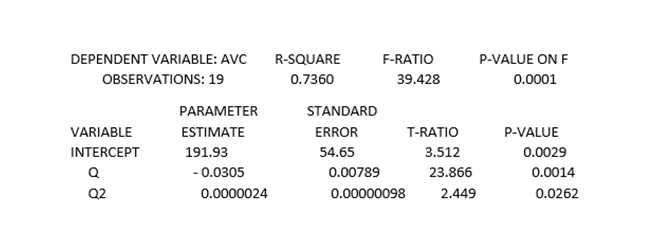
The chief economist for Argus Corporation, a large appliance manufacturer, estimated the firm’s short-run cost function for vacuum cleaners using an average variable cost function of the form AVC = a + bQ + cQ2 where AVC = dollars per vacuum cleaner and Q = number of vacuum cleaners produced each month. The total fixed cost each month is $180,000. The following results in the picture were obtained:

a) Are the estimates ˆa, ˆb, and cˆ statistically significant at the 2 percent level of significance? Which is/are significant and which is/are not?
b) Do the results indicate that the average variable cost curve is ∪-shaped? How do you know?
 c) If Argus Corporation produces 8,000 vacuum cleaners per month, what is the estimated average variable cost? Marginal cost? Total variable cost? Total cost?
 d) Answer part c, assuming that Argus produces 10,000 vacuum cleaners monthly.
 e) At what level of output will average variable cost be at a minimum? What is the minimum average variable cost?

DEPENDENT VARIABLE: AVC
R-SQUARE
F-RATIO
P-VALUE ON F
OBSERVATIONS: 19
0.7360
39.428
0.0001
PARAMETER
STANDARD
VARIABLE
ESTIMATE
ERROR
T-RATIO
P-VALUE
INTERCEPT
191.93
54.65
3.512
0.0029
Q
-0.0305
0.00789
23.866
0.0014
Q2
0.0000024
0.00000098
2.449
0.0262
Transcribed Image Text:DEPENDENT VARIABLE: AVC R-SQUARE F-RATIO P-VALUE ON F OBSERVATIONS: 19 0.7360 39.428 0.0001 PARAMETER STANDARD VARIABLE ESTIMATE ERROR T-RATIO P-VALUE INTERCEPT 191.93 54.65 3.512 0.0029 Q -0.0305 0.00789 23.866 0.0014 Q2 0.0000024 0.00000098 2.449 0.0262
Expert Solution
trending now

Trending now

This is a popular solution!

steps

Step by step

Solved in 2 steps with 1 images

Blurred answer
Knowledge Booster
Cost Function
Learn more about
Need a deep-dive on the concept behind this application? Look no further. Learn more about this topic, economics and related others by exploring similar questions and additional content below.
Similar questions
  • SEE MORE QUESTIONS
Recommended textbooks for you
ENGR.ECONOMIC ANALYSIS
Economics
ISBN:
9780190931919
Author:
NEWNAN
Publisher:
Oxford University Press
Principles of Economics (12th Edition)
Economics
ISBN:
9780134078779
Author:
Karl E. Case, Ray C. Fair, Sharon E. Oster
Publisher:
PEARSON
Engineering Economy (17th Edition)
Economics
ISBN:
9780134870069
Author:
William G. Sullivan, Elin M. Wicks, C. Patrick Koelling
Publisher:
PEARSON
Principles of Economics (MindTap Course List)
Economics
ISBN:
9781305585126
Author:
N. Gregory Mankiw
Publisher:
Cengage Learning
Managerial Economics: A Problem Solving Approach
Economics
ISBN:
9781337106665
Author:
Luke M. Froeb, Brian T. McCann, Michael R. Ward, Mike Shor
Publisher:
Cengage Learning
Managerial Economics & Business Strategy (Mcgraw-…
Economics
ISBN:
9781259290619
Author:
Michael Baye, Jeff Prince
Publisher:
McGraw-Hill Education