a) Calculate the forecasted registrations for years 2 through 12 using exponential smoothing, with a smoothing constant (a) of 0.40 and a starting forecast of 6.00 for year 1 (round your responses to one decimal place): Year 4 6 7 10 11 12 Forecast (000) 6.00
a) Calculate the forecasted registrations for years 2 through 12 using exponential smoothing, with a smoothing constant (a) of 0.40 and a starting forecast of 6.00 for year 1 (round your responses to one decimal place): Year 4 6 7 10 11 12 Forecast (000) 6.00

Practical Management Science
6th Edition
ISBN:9781337406659
Author:WINSTON, Wayne L.
Publisher:WINSTON, Wayne L.
Chapter13: Regression And Forecasting Models
Section13.7: Exponential Smoothing Models
Problem 26P: The file P13_26.xlsx contains the monthly number of airline tickets sold by the CareFree Travel...

Related questions

Question
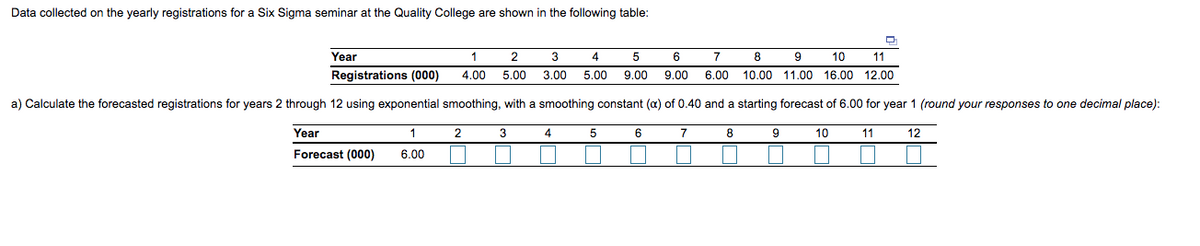
Transcribed Image Text:Data collected on the yearly registrations for a Six Sigma seminar at the Quality College are shown in the following table:
Year
1
5
6.
7
8
9
10
11
Registrations (000)
4.00
5.00
3.00
5.00
9.00
9.00
6.00
10.00 11.00 16.00 12.00
a) Calculate the forecasted registrations for years 2 through 12 using exponential smoothing, with a smoothing constant (a) of 0.40 and a starting forecast of 6.00 for year 1 (round your responses to one decimal place):
Year
1
2
3
5
6
7
10
11
12
Forecast (000)
6.00
Expert Solution
This question has been solved!
Explore an expertly crafted, step-by-step solution for a thorough understanding of key concepts.

This is a popular solution!

Trending now
This is a popular solution!

Step by step
Solved in 2 steps with 2 images

Knowledge Booster


Learn more about
Need a deep-dive on the concept behind this application? Look no further. Learn more about this topic, operations-management and related others by exploring similar questions and additional content below.Recommended textbooks for you
Practical Management Science
Operations Management
ISBN:
9781337406659
Author:
WINSTON, Wayne L.
Publisher:
Cengage,

Contemporary Marketing
Marketing
ISBN:
9780357033777
Author:
Louis E. Boone, David L. Kurtz
Publisher:
Cengage Learning
Practical Management Science
Operations Management
ISBN:
9781337406659
Author:
WINSTON, Wayne L.
Publisher:
Cengage,
Contemporary Marketing
Marketing
ISBN:
9780357033777
Author:
Louis E. Boone, David L. Kurtz
Publisher:
Cengage Learning