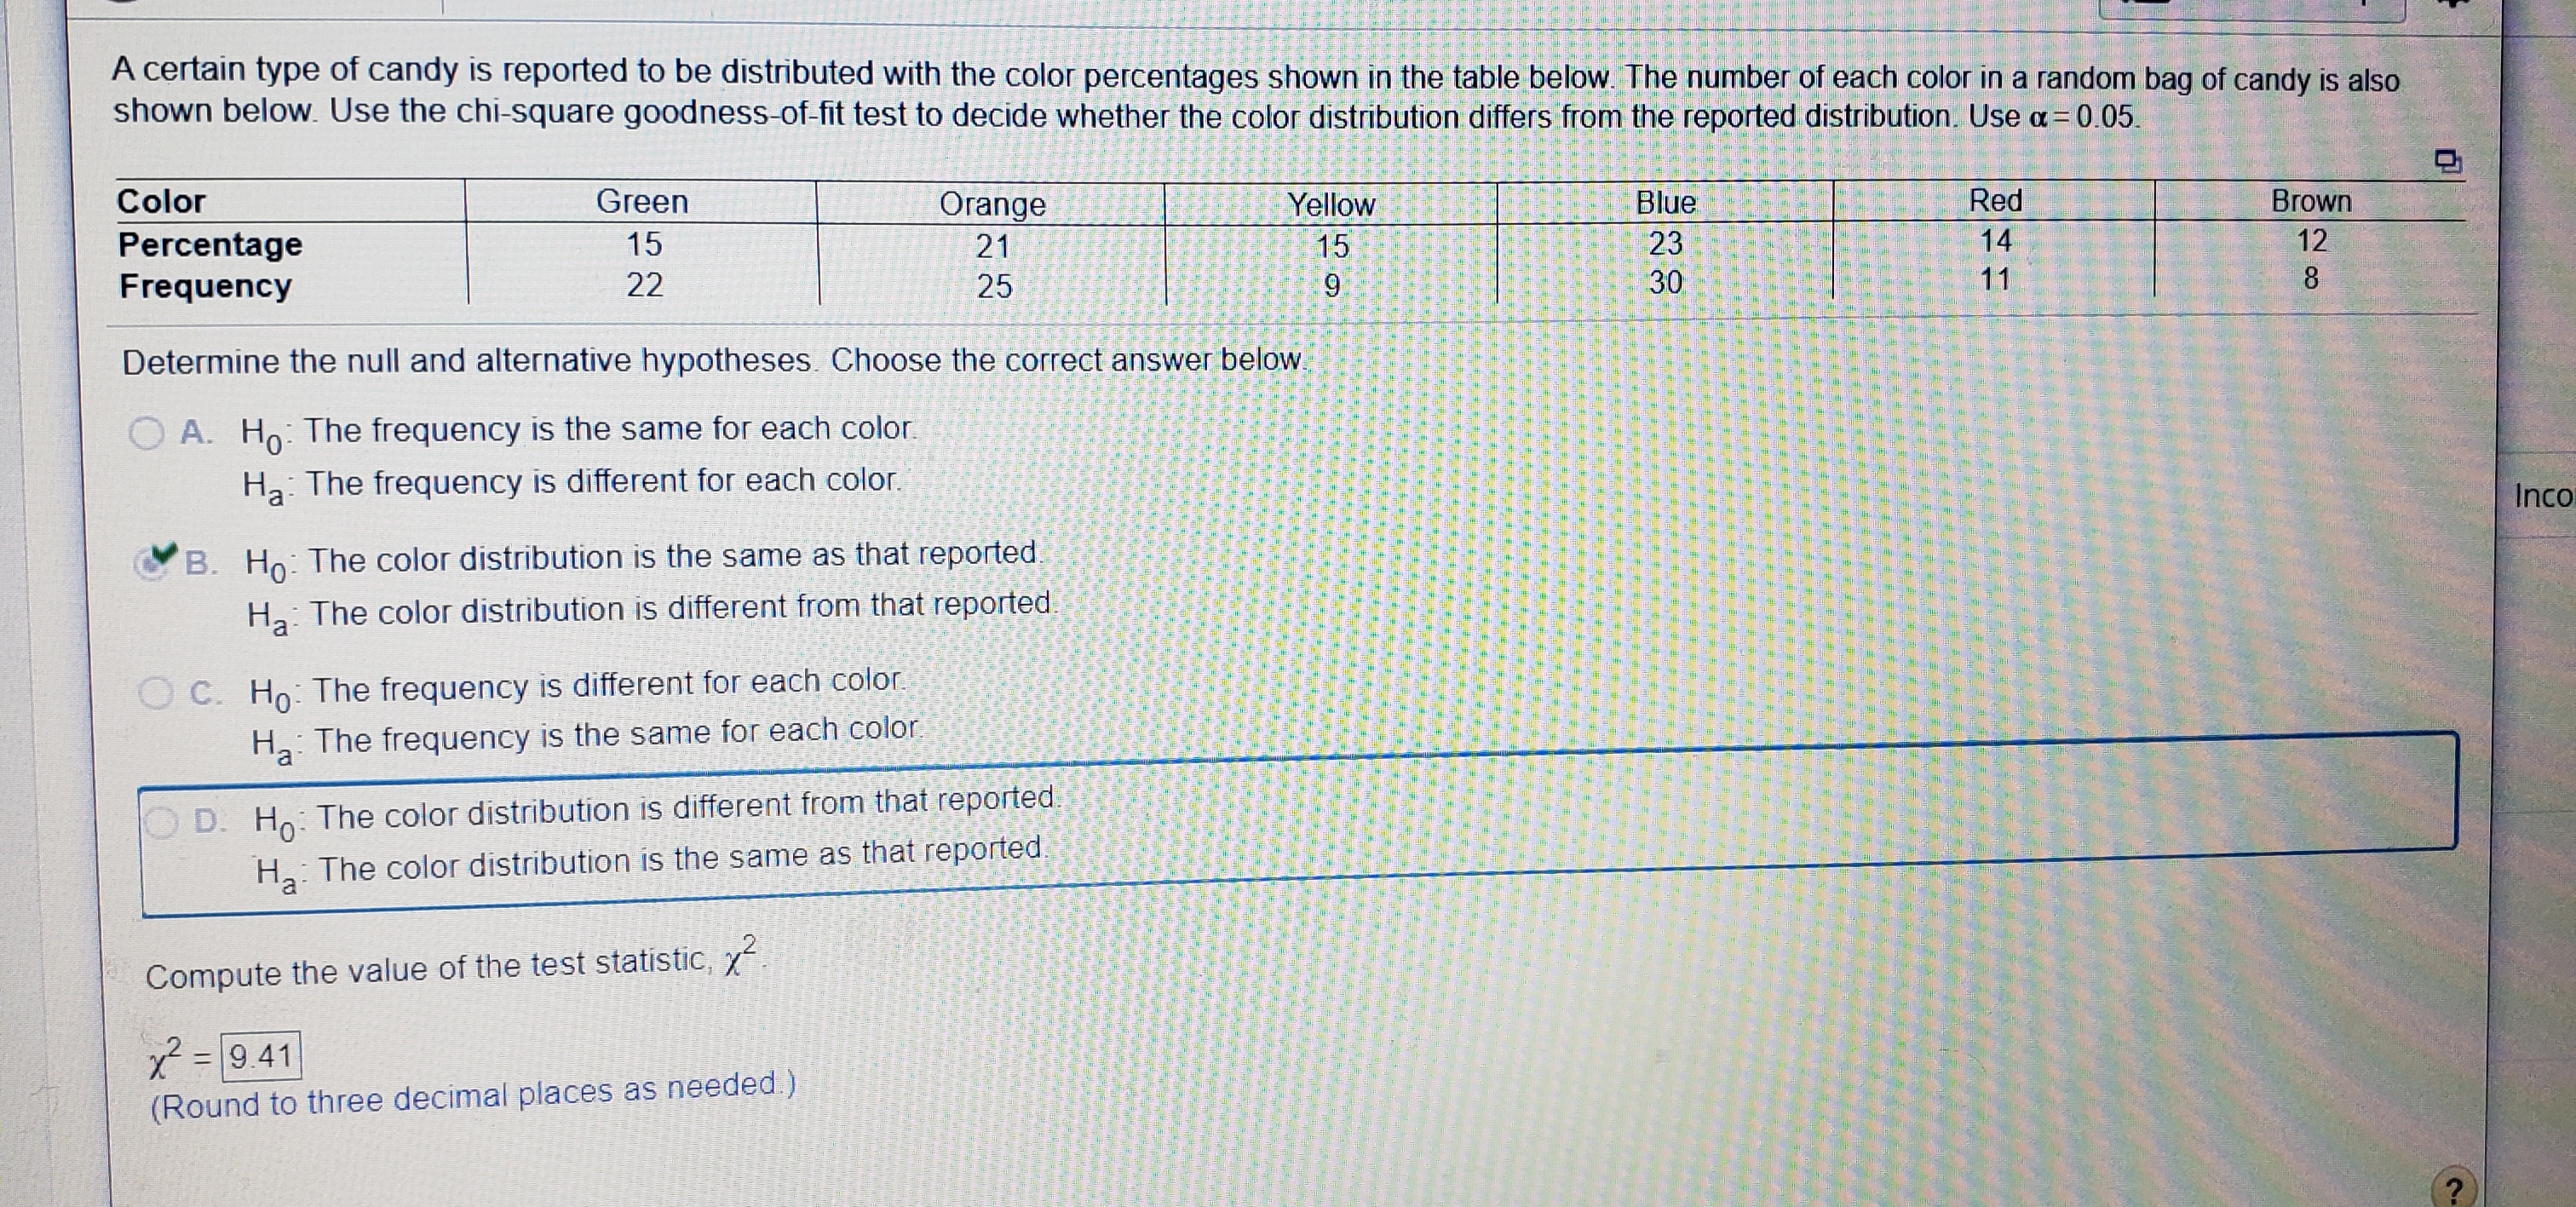
A certain type of candy is reported to be distributed with the color percentages shown in the table below. The number of each color in a random bag of candy is also shown below. Use the chi-square goodness-of-fit test to decide whether the color distribution differs from the reported distribution. Use a=0.05. Red 14 Color Green Brown Yellow 15 Orange Blue 15 23 12 Percentage Frequency 21 22 25 30 11 Determine the null and alternative hypotheses. Choose the correct answer below. A. Ho: The frequency is the same for each color. Ha: The frequency is different for each color. Inco B. Ho: The color distribution is the same as that reported. Ha: The color distribution is different from that reported. O C. Ho: The frequency is different for each color H: The frequency is the same for each color OD. Ho: The color distribution is different from that reported. H: The color distribution is the same as that reported. Compute the value of the test statistic, x = 9.41 (Round to three decimal places as needed.)


Quadratic Equation
When it comes to the concept of polynomial equations, quadratic equations can be said to be a special case. What does solving a quadratic equation mean? We will understand the quadratics and their types once we are familiar with the polynomial equations and their types.
Demand and Supply Function
The concept of demand and supply is important for various factors. One of them is studying and evaluating the condition of an economy within a given period of time. The analysis or evaluation of the demand side factors are important for the suppliers to understand the consumer behavior. The evaluation of supply side factors is important for the consumers in order to understand that what kind of combination of goods or what kind of goods and services he or she should consume in order to maximize his utility and minimize the cost. Therefore, in microeconomics both of these concepts are extremely important in order to have an idea that what exactly is going on in the economy.
I need help getting X2, I cant find a way to compute this on my TI-84 calculator


Trending now
This is a popular solution!

Step by step
Solved in 2 steps with 3 images


