A college entrance exam company determined that a score of 25 on the mathematics portion of the exam suggests that a student is ready for college-level mathematics. To achieve this goal, the company recommends that students take a core curriculum of math courses in high school. Suppose a random sample of 150 students who completed this core set of courses results in a mean math score of 25.6 on the college entrance exam with a standard deviation of 3.3. Do these results suggest that students who complete the core curriculum are ready for college-level mathematics? That is, are they scoring above 25 on the mathematics portion of the exam? Complete parts a) through d) below. Click the icon to view the table of critical t-values. (c) Use the P-value approach at the a = 0.10 level of significance to test the hypotheses in part (a). Identify the test statistic. to = (Round to two decimal places as needed.) Approximate the P-value. The P-value is in the range (d) Write a conclusion based on the results. V the null hypothesis and claim that there V sufficient evidence to conclude that the population mean is v than 25.
A college entrance exam company determined that a score of 25 on the mathematics portion of the exam suggests that a student is ready for college-level mathematics. To achieve this goal, the company recommends that students take a core curriculum of math courses in high school. Suppose a random sample of 150 students who completed this core set of courses results in a mean math score of 25.6 on the college entrance exam with a standard deviation of 3.3. Do these results suggest that students who complete the core curriculum are ready for college-level mathematics? That is, are they scoring above 25 on the mathematics portion of the exam? Complete parts a) through d) below. Click the icon to view the table of critical t-values. (c) Use the P-value approach at the a = 0.10 level of significance to test the hypotheses in part (a). Identify the test statistic. to = (Round to two decimal places as needed.) Approximate the P-value. The P-value is in the range (d) Write a conclusion based on the results. V the null hypothesis and claim that there V sufficient evidence to conclude that the population mean is v than 25.

MATLAB: An Introduction with Applications
6th Edition
ISBN:9781119256830
Author:Amos Gilat
Publisher:Amos Gilat
Chapter1: Starting With Matlab
Section: Chapter Questions
Problem 1P

Related questions
Question
20
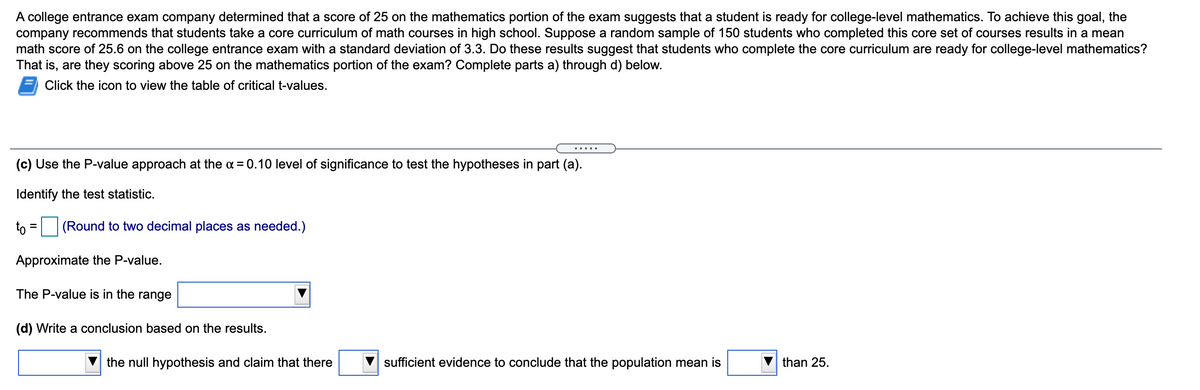
Transcribed Image Text:A college entrance exam company determined that a score of 25 on the mathematics portion of the exam suggests that a student is ready for college-level mathematics. To achieve this goal, the
company recommends that students take a core curriculum of math courses in high school. Suppose a random sample of 150 students who completed this core set of courses results in a mean
math score of 25.6 on the college entrance exam with a standard deviation of 3.3. Do these results suggest that students who complete the core curriculum are ready for college-level mathematics?
That is, are they scoring above 25 on the mathematics portion of the exam? Complete parts a) through d) below.
Click the icon to view the table of critical t-values.
.... .
(c) Use the P-value approach at the a = 0.10 level of significance to test the hypotheses in part (a).
Identify the test statistic.
to =
(Round to two decimal places as needed.)
Approximate the P-value.
The P-value is in the range
(d) Write a conclusion based on the results.
the null hypothesis and claim that there
sufficient evidence to conclude that the population mean is
than 25.
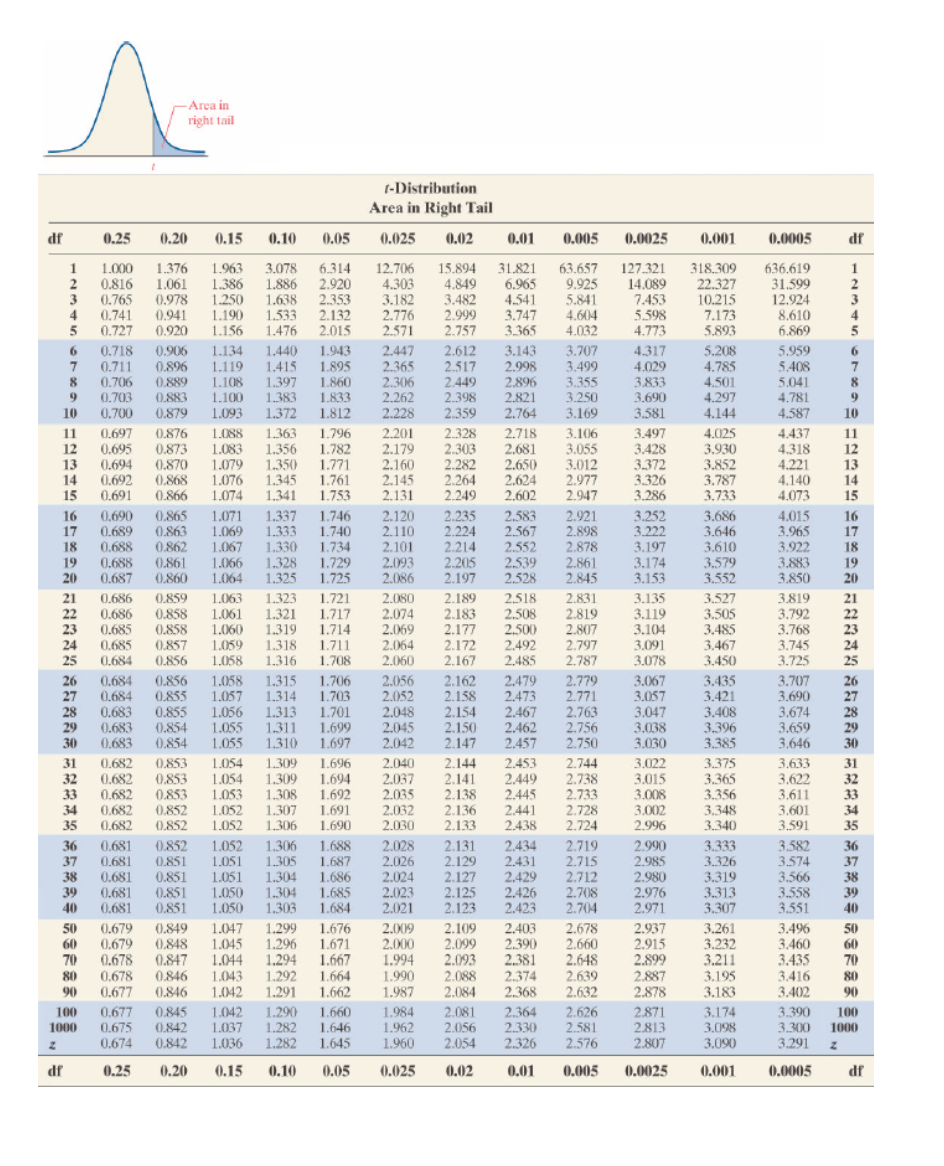
Transcribed Image Text:Area in
right tail
(-Distribution
Area in Right Tail
df
0,25
0.20
0.15
0.10
0.05
0.025
0.02
0.01
0.005
0.0025
0.001
0,0005
df
1.000
2
0,816
3
0.765
4
0,741
5
0.727
12.706
4.303
3.182
2.776
2.571
15.894
4,849
3.482
2.999
2.757
31.821
6.965
4.541
3.747
3.365
63.657
9.925
5.841
4.604
4.032
318.309
22.327
10.215
7.173
5.893
636.619
31,599
12.924
8.610
6.869
1
1.376
1.061
0.978
0.941
0.920
1.963
1.386
1.250
1.190
1.156
3.078
1.886
1.638
1.533
1.476
6.314
2.920
2.353
2.132
2.015
127.321
14.089
7.453
5.598
4.773
1
2
3
4
5
1.134
1.119
1.108
1.100
1.093
0.718 0.906
1.440
1.415
1.397
1.383
1.372
1.943
1.895
1.860
1.833
1.812
2.447
2.365
2.306
2.262
2.228
2.612
2.517
2.449
2.398
3.143
2.998
2.896
2.821
2,764
3.707
3.499
3.355
3.250
4.317
5.208
4.785
4.501
4.297
4.144
5.959
5.408
5.041
4.781
4.587
0.711
0.896
4.029
3.833
3.690
3.581
7
8
0.706 0.889
0.703
9
0.700
0.883
0.879
8
9
10
2.359
3.169
10
2.328
2.303
2.282
2.264
2.249
4.025
3.930
3.852
3.787
3.733
4.437
4.318
4.221
4.140
4.073
11
0.697
0,876
0.873
0.870
1.088
1.363
1.796
2.201
2.718
3.106
3.055
3.012
2.977
2.947
3.497
11
12
13
14
0.695
0.694
0,692
0.691
1.083
1.079
1.076
1.074
1.356
1.350
1.345
1.341
1.782
1.771
1.761
1.753
2.179
2.160
2.145
2.131
2.681
2,650
2,624
2.602
3.428
3.372
3.326
3.286
12
13
0.868
14
15
0.866
15
1.071
1.069
1.067
2.120
2.110
2.101
2.093
2.583
2.567
2.552
2.539
2.528
2.235
2.224
4.015
3.965
3.922
3.883
3.850
0.690 0.865
1.337
1.333
1.330
1.746
1.740
1.734
1.729
1.725
2.921
2.898
2.878
2.861
2.845
3.252
3,222
3.197
3.174
3.153
16
17
3.686
3.646
16
0.689 0.863
0.688 0.862
0.688 0.861
0.687 0.860
17
18
19
20
1.066 1.328
1.064
1.325
2.214
2.205
2.197
3.610
3.579
3.552
18
19
20
2.086
2.189
2.183
2.177
2.518
2.508
2.500
2.492
2.485
3.135
3.119
3.104
3.527
3.505
3.485
3.819
3.792
3.768
21
0.686
0.859
1.063
1.061
0.858 1.060 1.319
1.059
1.058 1.316
1.323
1.721
2.080
2.831
2.819
2.807
2.797
2.787
21
22
23
22
0.686
0.685
0,685
0.858
1.321
1.717
1.714
1.318 1.711
1.708
2.074
2.069
2.064
2.060
23
24
0.857
2.172
3.091
3.467
3.745
24
25
0.684
0.856
2.167
3.078
3.450
3.725
25
0.856
0.855
0.855
0.854
0.854
1.058
1.057
1.056 1.313
1.055
1.055
1.706
1.703
1.701
1.699
1.697
3.707
3.690
3.674
3.659
3.646
2.779
3.435
3.421
3.408
3.396
3.385
26
1.315
1.314
2.056
2.052
2.048
2.045
2.042
2.162
2.158
2.154
2.150
2.479
2.473
2,467
2.462
2.457
3.067
3.057
3.047
3.038
3.030
26
27
28
29
30
0.684
0.684
0,683
0.683
0.683
2.771
27
1.311
1.310
2.763
2.756
2.750
28
29
2.147
30
31
32
33
0.682
0.682
0.682
0.682
0,682
0.853
0.853
0.853
1.309
1.309
1.308
1.307
1.306
2.040
2.037
2.035
2.032
2.030
2.144
2.141
2.138
2.136
2.133
3.633
3.622
3.611
3,601
3.591
1.054
1.696
2.453
2.449
2.445
2.441
2.438
2.744
1.054
1.053
1.052
1.052
1.694
1.692
1.691
1.690
2.738
2.733
2.728
2.724
3.022
3.015
3.008
3,002
2.996
3.375
3.365
3.356
3.348
3.340
31
32
33
34
35
0.852
34
0,852
35
3.582
3.574
36
0.852
0.851
0.851
0.851
0.851
1.052
1.051
1.306
1.305
1.304
1.304
1.303
1.688
2.028
2.026
2.024
2.023
2.021
2.131
2.129
2.127
2.125
2.123
2.434
2.719
2.715
2.990
2.985
2.980
2.976
2.971
3.333
36
37
0.681
3.326
3.319
3.313
3.307
37
0.681
1.687
2.431
38
39
40
0.681
0.681
0.681
1.051
1.050
1.050
1.686
1.685
1.684
2.429
2.426
2.423
2.712
2.708
2.704
3.566
3.558
3.551
38
39
40
50
60
70
0.679
0.679
0.678 0.847
0.678
0.677
1.299
1.296
1.294
1.292
1.291
1.676
1.671
1.667
2.678
2.660
2.648
2.639
2.632
2.937
2.915
2.899
2.887
2.878
3.261
3.232
3.211
3.195
3.496
3.460
3.435
3.416
3.402
0,849
1.047
1.045
1.044
1.043
1.042
2.009
2.000
1.994
1.990
1.987
2.109
2.099
2.093
2.088
2.084
2.403
2,390
2.381
2.374
2.368
50
0.848
60
70
80
0.846
1.664
80
90
0.846
1.662
3.183
90
0.677
0,675
0.674
0.845
0.842
0.842
1.042
1.037
1.036
1.290
1.282
1.282
1.660
1.646
1.645
2.081
2.056
2.054
2.364
2.330
2.326
2.626
2.581
2.576
2.871
2.813
2.807
3.390
100
1000
1.984
1.962
1.960
3.174
3.098
3.090
100
3.300 1000
3.291
df
0.25
0.20
0.15
0.10
0.05
0.025
0.02
0.01
0.005
0.0025
0.001
0.0005
df
Expert Solution
This question has been solved!
Explore an expertly crafted, step-by-step solution for a thorough understanding of key concepts.

This is a popular solution!

Trending now
This is a popular solution!

Step by step
Solved in 3 steps with 1 images

Recommended textbooks for you
MATLAB: An Introduction with Applications
Statistics
ISBN:
9781119256830
Author:
Amos Gilat
Publisher:
John Wiley & Sons Inc

Probability and Statistics for Engineering and th…
Statistics
ISBN:
9781305251809
Author:
Jay L. Devore
Publisher:
Cengage Learning

Statistics for The Behavioral Sciences (MindTap C…
Statistics
ISBN:
9781305504912
Author:
Frederick J Gravetter, Larry B. Wallnau
Publisher:
Cengage Learning
MATLAB: An Introduction with Applications
Statistics
ISBN:
9781119256830
Author:
Amos Gilat
Publisher:
John Wiley & Sons Inc
Probability and Statistics for Engineering and th…
Statistics
ISBN:
9781305251809
Author:
Jay L. Devore
Publisher:
Cengage Learning
Statistics for The Behavioral Sciences (MindTap C…
Statistics
ISBN:
9781305504912
Author:
Frederick J Gravetter, Larry B. Wallnau
Publisher:
Cengage Learning

Elementary Statistics: Picturing the World (7th E…
Statistics
ISBN:
9780134683416
Author:
Ron Larson, Betsy Farber
Publisher:
PEARSON

The Basic Practice of Statistics
Statistics
ISBN:
9781319042578
Author:
David S. Moore, William I. Notz, Michael A. Fligner
Publisher:
W. H. Freeman

Introduction to the Practice of Statistics
Statistics
ISBN:
9781319013387
Author:
David S. Moore, George P. McCabe, Bruce A. Craig
Publisher:
W. H. Freeman