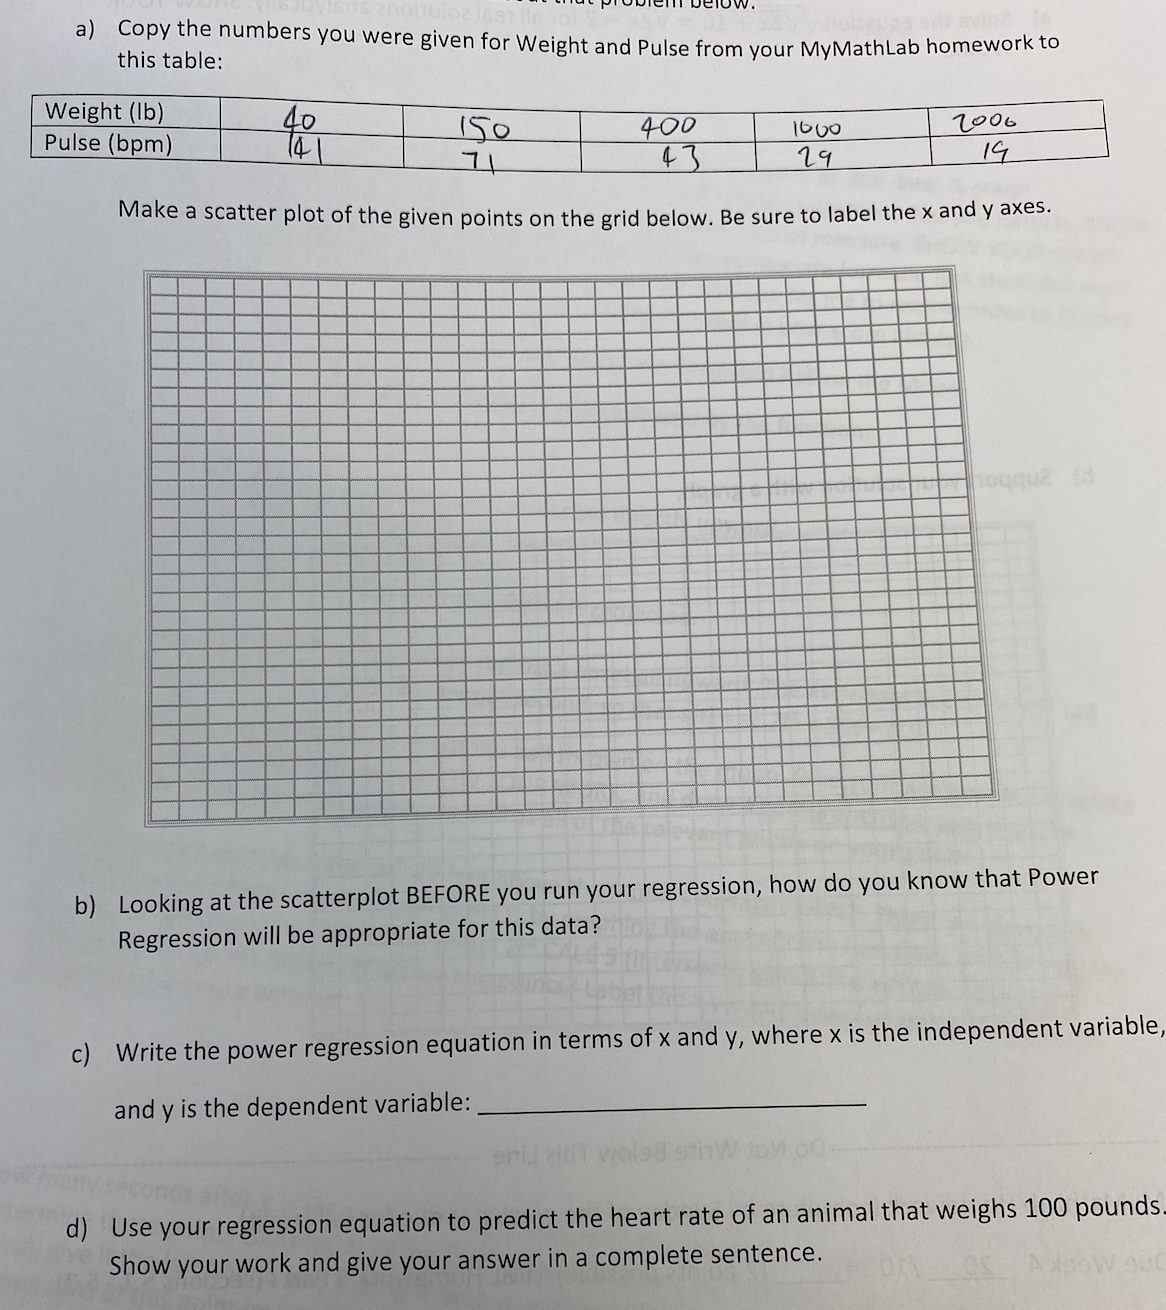
a) Copy the numbers you were given for Weight and Pulse from your MyMathLab homework to this table: Weight (Ib) Pulse (bpm) 40 2006 19 150 400 43 1600 29 7t Make a scatter plot of the given points on the grid below. Be sure to label the x and y axes. hoqqu2 b) Looking at the scatterplot BEFORE you run your regression, how do you know that Power Regression will be appropriate for this data? c) Write the power regression equation in terms of x and y, where x is the independent variable, and y is the dependent variable: d) Use your regression equation to predict the heart rate of an animal that weighs 100 pounds. Show your work and give your answer in a complete sentence.
Q: 3) The following data was collected regarding height and weight of a particular group. Height 70"…
A: For the given data ( a ) Develop scatter plot ( b ) Find regression equation ( c ) predict y when x…
Q: Use the given data to find the equation of the regression line. Examine the scatterplot and identify…
A: Regression line is given by,
Q: Refer back to the data in Exercise 4, in which y = ammo- nium concentration (mg/L) and x…
A: Given that, y = ammonium concentration (mg/L) and x transpiration (ml/h). Summary quantities include…
Q: The following table displays the mathematics test scores for a random sample of college students,…
A:
Q: 233 4SS G6 10 11 12 15 19 20 18 Pind the regression ne for the data. Assumeis the dificuty level and…
A: We have given that, X:- 2, 3, 3, 4, 5, 6, 6, 6 Y:- 10, 11, 12, 9, 15, 19, 20, 18 Then, We will find…
Q: Use the given data to find the equation of the regression line. Examine the scatterplot and identify…
A:
Q: The following data was taken from experiment. The data can be modeled by the following equation. ya…
A: image is attached
Q: ta are available for a river that is to be dammed: 2 104.1 139.7 127.0 94.0 116.8 99.1 15.3 23.2…
A: (1) Let Y = a+bx be the regression line. Here the dependent variable Y is water flow and the…
Q: Write one equation for auxiliary regression for testing multi- collinearity? State the condition for…
A: Given information: The information about multicollinearity is given.
Q: Use the given data to find the equation of the regression line. Examine the scatterplot and identify…
A: For the given data Find the regression line Select the correct choice
Q: Based on the data shown below, calculate the regression line (each value to two decimal places) y =…
A: Calculate the mean of X and Y.
Q: An agricultural experimenter divided a tract of land into seven plots of equal size. Each plot was…
A: 3.0 53 159 9 3.5 57 199.5 12.25 4.0 56 224 16 4.5 54 243 20.25 5.0 62 310 25 5.5 59 324.5…
Q: Use the given data to find the equation of the regression line. Examine the scatterplot and identify…
A:
Q: The manufacturer of Beanie Baby dolls used quarterly price data for 2012/- 2020/ (t 1, ., 36) and…
A: It is needed to test whether there is a significant trend in the price of dolls.
Q: Use the sample data given in table x 1 2 3 4 5 y 3 4 1 2 1 a) To Write the regression equation…
A: Given Data : X Y 1 3 2 3 3 1 4 2 5 1 Below table will be used to calculate the…
Q: Isider the following estimated regression In Y, = 2.57 + 0.212 InKt + 0.343 InLt + 0.030 InWt (2.90)…
A: Q
Q: Use the given data to find the equation of the regression line. Examine the scatterplot and identify…
A: Given data, X Y X*Y X*X 15 20.45 306.75 225 8 14.64 117.12 64 11 19.41 213.51 121 7…
Q: Based on the data shown below, calculate the regression line (each value to at least two decimal…
A: Enter the given data into the excel as follows:
Q: The data shown below were obtained on a highway. Use regression analysis to fit these data to the…
A: (a) We have, to calculate mean free speed. Let us tabulate the following table: Speed (mi/h) Yi…
Q: The accompanying data resulted from an experiment in which weld diameter and shear strength (in…
A: a) The predicted value is 864. Interpretation: The point estimate of the strength is 864 for the…
Q: We have the following data for 17 countries: A researcher estimates a regression using the above…
A: Heteroscedasticity means that the data has unequal variability or scatter across the set of the…
Q: An agent for a real estate company in a large city would like to be able to predict the monthly…
A: Using Excel > data > Data analysis > regression, we get:
Q: Cigarettes consumed per capita in 1930 (X) 530 1115 1145 510 380 Observation # Country Switzerland…
A:
Q: With the help of data given in the following table calculate regression line Y'. ΣΧ ΣΥ ΣΧΥ Σχ2 15 25…
A:
Q: The following table displays the mathematics test scores for a random sample of college students,…
A:
Q: Use the given data to find the equation of the regression line. Examine the scatterplot and identify…
A: Use EXCEL to obtain the regression equation. EXCEL procedure: Go to EXCEL Go to Data>Data…
Q: In an article in the American Journal or / Clinical Pathology, by Metz et al. (A-4) published the…
A: Answer:----. Date:----11/10/2021
Q: Use the given data to find the equation of the regression line. Examine the scatterplot and identify…
A: Given that : By using regression analysis. X Y X \cdot YX⋅Y X^2X2 Y^2Y2 7 7.50 52.5 49…
Q: The figures for Triple A's revenue and the amount of money earned by wage earners in Albany - NY has…
A: The required table for the given data can be formed as follows Y X (X-X_bar)^2 (Y-Y)(X-X) 6.5…
Q: Use the given data to find the equation of the regression line. Examine the scatterplot and identify…
A: We have given,
Q: Use the given data to find the equation of the regression line. Examine the scatterplot and identify…
A: Given: The data given is as follows x y 11 11.06 7 8.26 5 4.74 8 9.5 10 10.9 9 10.38…
Q: The following experimental data points are to be fitted to this 3-model parameter equation: In(y) =…
A: Given: The parameter equation is ln(y) = a - b(x + c)-1 and x -16 -6 11 34 65 y 10 20 60 200…
Q: Use the given data to find the equation of the regression line. Examine the scatterplot and identify…
A: Step-by-step procedure to find the regression equation using Excel: In Excel sheet, enter x in one…
Q: d dala, Odvlo Satistacuion as i anert that fnas ule lar Categoncal able department has muniple…
A: Modify the data as follows: Department Satisfaction X1 X2 X3 X4 X5 X6 Management 9 0 1 0 0 0 1…
Q: Q2 The following data is the pull strength of a wire bond in a semiconductor manufacturing process,…
A:
Q: Use the given data to find the equation of the regression line. Examine the scatterplot and identify…
A: Given datax y13 17.1411 16.865 7.547 12.0612 17.188 13.80…
Q: Consider the setting of Exercise 1. The residuals corresponding to the LSQ line, HR = 133.72 – 280.8…
A: Note: Hi there! Thank you for posting the question. As you have posted multiple questions, as per…
Q: Question B,C, and D
A: (b) From the given scatterplot, increments of the weights are very drastic compared to the values of…
Q: In order to determine the relationship between the number of units sold of a company's product (y)…
A: Given: Number of units sold y = 550 , 545, 540, 600, 600, 510, 570, 650, 615 Competitor price x1=…
Q: Use the given data to find the equation of the regression line. Examine the scatterplot and identify…
A:
Q: Listed below are the overhead widths (cm) of seals measured from photographs and the weights (kg) of…
A: Extrapolation:If anyone wants to estimate a value of the dependent variable for a value of…
Q: Based on the data shown below, calculate the regression line (each value to two decimal places) y =…
A:
Q: The price X (dollars per pound) and consumption y (in pounds per capita) of beef were samples for 10…
A: For the given data Standard error ( Se ) =?
Q: Use the given data to find the equation of the regression line. Examine the scatterplot and identify…
A: The independent variable is x. The dependent variable is y. This is simple linear regression model.…
Q: A study of the amount of rainfall and the quantity of air pollution removed produced the following…
A:
Q: Use the data given to solve the following problems. Savings needed for Health-Care Expenses During…
A: The regression is a method of machine learning under subgroup Supervised Learning. The regression…
Q: An agent for a real estate company in a large city would like to be able to predict the monthly…
A: Use EXCEL to obtain the value correlation coefficient. EXCEL procedure: Go to EXCEL Go to…
Q: The following table displays the mathematics test scores for a random sample of college students,…
A: Given data : Sr. No. Mathematics test(x) SY16C grades(y) 1 39 65 2 43 78 3 21…
Trending now
This is a popular solution!
Step by step
Solved in 2 steps with 2 images
- The accompanying data resulted from an experiment in which weld diameter and shear strength (in pounds) were determined for five different spot welds on steel. Below are the data collected and the regression equation. Diameter Strength 200.1 813.7 210.1 785.3 220.1 960.4 230.1 1118.0 240.0 1076.2 Strength = -941.6992 + 8.5988*Diameter The predicted y-hat value for a diameter of 201 is 864. if we observed a weld that had a diameter of 235 that had a strength 1000, what would be its residual?Use the sample data given in tablex 1 2 3 4 5y 3 4 1 2 1a) To Write the regression equation ̂y=mx+bb) Plot the regression equation and the scatter diagram on the same graphThe accompanying data resulted from an experiment in which weld diameter and shear strength (in pounds) were determined for five different spot welds on steel. Below are the data collected and the regression equation. Diameter Strength 200.1 813.7 210.1 785.3 220.1 960.4 230.1 1118.0 240.0 1076.2 Strength = -941.6992 + 8.5988*Diameter a)The predicted y-hat value for a diameter of 201 is 864. Interpret this predicted value. b)what is the predicted strength of a weld with a diameter of 51?
- The prelim grades (x) and midterm grades (y) of a sample of 10 MMW students is modeled by the regression line y = 12.0623 + 0.7771x. Estimate the prelim grade if the midterm grade is 83.The table below list weights (carats) and prices (dollars) of randomly selected diamonds Weight 0.3 0.4 0.5 0.5 1.0 0.7 Price 510 1151 1343 1410 5669 2277 Find r Test with a .05 level of significance H0 : ρ = 0 and H1: : ρ ≠ 0 Find m and b for simple regressionIn a manufacturing process the assembly line speed (feet per minute) was thought toaffect the number of defective parts found during the inspection process. To test thistheory, managers devised a situation in which the same batch of parts was inspectedvisually at a variety of line speeds. They collected the following data.Line SpeedNumber of DefectiveParts Found20 2120 1940 1530 1660 1440 17a. Develop the estimated regression equation that relates line speed to thenumber of defective parts found.b. At a .05 level of significance, determine whether line speed and number ofdefective parts found are related.c. Did the estimated regression equation provide a good fit to the data?d. Develop a 95% confidence interval to predict the mean number of defectiveparts for a line speed of 50 feet per minute.
- The following table displays the mathematics test scores for a random sample of college students, along with their final SY16C grades. a. Fit the regression line y = a+bx to the data and interpret the results. b. Use the regression equation to determine the SY16C grade for a college student who scored 60 on their achievement test. What would their SY16C grade be? Mathematics test (x) SY16C grades (y) 1 39 65 2 43 78 3 21 52 4 64 82 5 57 92 6 47 89 7 28 73 8 75 98 9 34 56Note:- please answer question B. using the blow information and image. 10. Using a sample of 546 observations, a researcher is interested infinding factors that influence house prices (measured in tenthousands). The researcher run regression of Hedonic price modelthat explain house prices using lot size, bed rooms, bath rooms,stories all are measured in number of units and dummy variables 2whether the house has air-conditioning, drive way, recreation room,glass show , full basement, garage place and preferred area the resultsare shown below.The following table displays the mathematics test scores for a random sample ofcollege students, along with their final SY16C grades.a. Fit the regression line y=a+bx to the data and interpret the results.b. Use the regression equation to determine the SY16C grade for a college student whoscored 60 on their achievement test. What would their SY16C gradebe? Mathematics test(x) SY16C grades(y)1 39 652 43 783 21 524 64 825 57 926 47 897 28 738 75…
- The authors of a paper were interested in how the distance a deer mouse will travel for food is related to the distance from the food to the nearest pile of debris. Distances were measured in meters. The data and computer output are given below. Distance from Debris Distance Traveled 6.94 0.00 5.23 6.13 5.21 11.29 7.10 14.35 8.16 12.03 5.50 22.72 9.19 20.11 9.05 26.16 9.36 30.65 Simple Linear Regression Results: Dependent Variable: Traveled Independent Variable: Debris Sample size: 9 R (correlation coefficient) = 0.5657 R-sq = 0.32002088 Estimate of error standard deviation 8.670711 Parameter estimates: Parameter Estimate Std. Err. Alternative DF T-Stat P-Value Intercept -7.6854587 13.332196 ≠ 0 7 -0.5764586 0.5824 Slope 3.2340908 1.7818117 ≠ 0 7 1.8150575 0.1124 a)What is the least squares regression line for the output given above? b) what is the predicted traveled distance given the distance from debris is 6.5 meters?The U.S. Postal Service is attempting to reduce the number of complaints made by the public against its workers. To facilitate this task, a staff analyst for the service regresses the number of complaints lodged against an employee last year on the hourly wage of the employee for the year. The analyst ran a simple linear regression in SPSS. The results are shown below. Table 7: Model Summary Model R R Square Adjusted R Square Std. Error of the Estimate 1 .854a .730 .695 6.6235 a. Predictors: (Constant), Hourly Wage Table 8: ANOVA ANOVAb Model Sum of Squares df Mean Square F Sig. 1 Regression 1918.458 1 1918.458 129.783 .000a Residual 709.567 48 14.782 Total 2628.025 49 a. Predictors: (Constant), Hourly Wage b. Dependent Variable: Number of Complaints Table 9: Coefficients Coefficientsa Model Unstandardized Coefficients Standardized Coefficients t…The U.S. Postal Service is attempting to reduce the number of complaints made by the public against its workers. To facilitate this task, a staff analyst for the service regresses the number of complaints lodged against an employee last year on the hourly wage of the employee for the year. The analyst ran a simple linear regression in SPSS. The results are shown below. Table 7: Model Summary Model R R Square Adjusted R Square Std. Error of the Estimate 1 .854a .730 .695 6.6235 a. Predictors: (Constant), Hourly Wage Table 8: ANOVA ANOVAb Model Sum of Squares df Mean Square F Sig. 1 Regression 1918.458 1 1918.458 129.783 .000a Residual 709.567 48 14.782 Total 2628.025 49 a. Predictors: (Constant), Hourly Wage b. Dependent Variable: Number of Complaints Table 9: Coefficients Coefficientsa Model Unstandardized Coefficients Standardized Coefficients t…