A data set includes data from 500 random tornadoes. The display from technology available below results from using the tornado lengths (miles) to test the claim that the mean tornado length is greater than 2.5 miles. Use a 0.05 significance level. Identify the nu and alternative hypotheses, test statistic, P-value, and state the final conclusion that addresses the original claim. Click the icon to view the display from technology. Assuming all conditions for conducting a hypothesis test are met, what are the null and alternative hypotheses? O A. Ho: H<2.5 miles H4: µ= 2.5 miles O B. Ho: µ= 2.5 miles H: µ#2.5 miles Ο D. Ho μ= 2.5 miles H,: µ> 2.5 miles O C. Ho: μ= 2.5 miles H,: µ<2.5 miles Identify the test statistic. (Round to two decimal places as needed.) Display from Technology Identify the P-value. (Round to three decimal places as needed.) Hypothesis test results: H: Mean of variable Ho : H= 2.5 HẠ> 2.5 Variable Sample Mean Length State the final conclusion that addresses the original claim. Ho. There is evidence to support the claim that the mean tornado length is greater than 2.5 miles T-Stat 2.77864 0.202015 499 1.379304| Std. Er. DF P-value 0.0842 Print Done
A data set includes data from 500 random tornadoes. The display from technology available below results from using the tornado lengths (miles) to test the claim that the mean tornado length is greater than 2.5 miles. Use a 0.05 significance level. Identify the nu and alternative hypotheses, test statistic, P-value, and state the final conclusion that addresses the original claim. Click the icon to view the display from technology. Assuming all conditions for conducting a hypothesis test are met, what are the null and alternative hypotheses? O A. Ho: H<2.5 miles H4: µ= 2.5 miles O B. Ho: µ= 2.5 miles H: µ#2.5 miles Ο D. Ho μ= 2.5 miles H,: µ> 2.5 miles O C. Ho: μ= 2.5 miles H,: µ<2.5 miles Identify the test statistic. (Round to two decimal places as needed.) Display from Technology Identify the P-value. (Round to three decimal places as needed.) Hypothesis test results: H: Mean of variable Ho : H= 2.5 HẠ> 2.5 Variable Sample Mean Length State the final conclusion that addresses the original claim. Ho. There is evidence to support the claim that the mean tornado length is greater than 2.5 miles T-Stat 2.77864 0.202015 499 1.379304| Std. Er. DF P-value 0.0842 Print Done

MATLAB: An Introduction with Applications
6th Edition
ISBN:9781119256830
Author:Amos Gilat
Publisher:Amos Gilat
Chapter1: Starting With Matlab
Section: Chapter Questions
Problem 1P

Related questions
Topic Video
Question
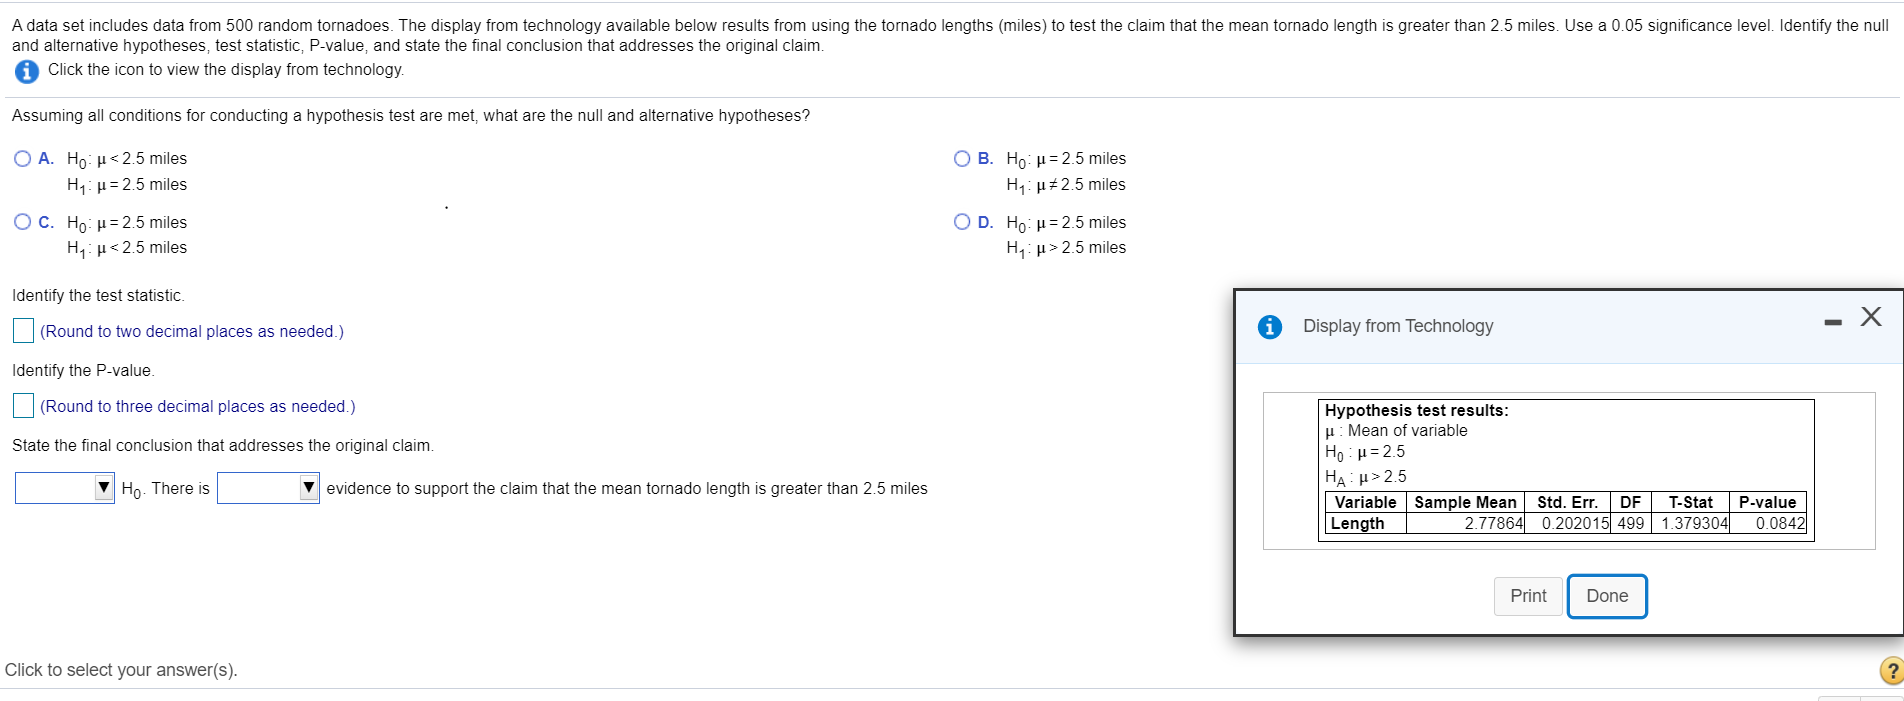
Transcribed Image Text:A data set includes data from 500 random tornadoes. The display from technology available below results from using the tornado lengths (miles) to test the claim that the mean tornado length is greater than 2.5 miles. Use a 0.05 significance level. Identify the nu
and alternative hypotheses, test statistic, P-value, and state the final conclusion that addresses the original claim.
Click the icon to view the display from technology.
Assuming all conditions for conducting a hypothesis test are met, what are the null and alternative hypotheses?
O A. Ho: H<2.5 miles
H4: µ= 2.5 miles
O B. Ho: µ= 2.5 miles
H: µ#2.5 miles
Ο D. Ho μ= 2.5 miles
H,: µ> 2.5 miles
O C. Ho: μ= 2.5 miles
H,: µ<2.5 miles
Identify the test statistic.
(Round to two decimal places as needed.)
Display from Technology
Identify the P-value.
(Round to three decimal places as needed.)
Hypothesis test results:
H: Mean of variable
Ho : H= 2.5
HẠ> 2.5
Variable Sample Mean
Length
State the final conclusion that addresses the original claim.
Ho. There is
evidence to support the claim that the mean tornado length is greater than 2.5 miles
T-Stat
2.77864 0.202015 499 1.379304|
Std. Er.
DF
P-value
0.0842
Print
Done
Expert Solution
This question has been solved!
Explore an expertly crafted, step-by-step solution for a thorough understanding of key concepts.

This is a popular solution!

Trending now
This is a popular solution!

Step by step
Solved in 3 steps with 5 images

Knowledge Booster


Learn more about
Need a deep-dive on the concept behind this application? Look no further. Learn more about this topic, statistics and related others by exploring similar questions and additional content below.Recommended textbooks for you
MATLAB: An Introduction with Applications
Statistics
ISBN:
9781119256830
Author:
Amos Gilat
Publisher:
John Wiley & Sons Inc

Probability and Statistics for Engineering and th…
Statistics
ISBN:
9781305251809
Author:
Jay L. Devore
Publisher:
Cengage Learning

Statistics for The Behavioral Sciences (MindTap C…
Statistics
ISBN:
9781305504912
Author:
Frederick J Gravetter, Larry B. Wallnau
Publisher:
Cengage Learning
MATLAB: An Introduction with Applications
Statistics
ISBN:
9781119256830
Author:
Amos Gilat
Publisher:
John Wiley & Sons Inc
Probability and Statistics for Engineering and th…
Statistics
ISBN:
9781305251809
Author:
Jay L. Devore
Publisher:
Cengage Learning
Statistics for The Behavioral Sciences (MindTap C…
Statistics
ISBN:
9781305504912
Author:
Frederick J Gravetter, Larry B. Wallnau
Publisher:
Cengage Learning

Elementary Statistics: Picturing the World (7th E…
Statistics
ISBN:
9780134683416
Author:
Ron Larson, Betsy Farber
Publisher:
PEARSON

The Basic Practice of Statistics
Statistics
ISBN:
9781319042578
Author:
David S. Moore, William I. Notz, Michael A. Fligner
Publisher:
W. H. Freeman

Introduction to the Practice of Statistics
Statistics
ISBN:
9781319013387
Author:
David S. Moore, George P. McCabe, Bruce A. Craig
Publisher:
W. H. Freeman