(a) Draw a line tangent to the graph at point P. hundred hundred thousand thousand 60 50+ 50 40 40 years vears since 2000 since 2000 hundred hundred thousand thousand 60 60 50 50 40 40 years since 2000 years since 2000 8 7 Estimate the slope of the tangent line to the nearest integer if P is located at (5, 50). (b) What are the units of measure for the slope of the tangent line? Ohundred thousand subscribers over the eight years number of subscribers O hundred thousand subscribers per year Onumber of years Write a sentence of interpretation for the slope of the graph at point P. In 2005, the total number of cellular subscribers was increasing by 50 Xhundred thousand per year. (c) Calculate the percentage rate of change at point P. (Round your answer to three decimal places.) % Interpret the percentage rate of change at point P. In 2005, the total number of cellular subscribers wasSelect-- by approximately % per year.
(a) Draw a line tangent to the graph at point P. hundred hundred thousand thousand 60 50+ 50 40 40 years vears since 2000 since 2000 hundred hundred thousand thousand 60 60 50 50 40 40 years since 2000 years since 2000 8 7 Estimate the slope of the tangent line to the nearest integer if P is located at (5, 50). (b) What are the units of measure for the slope of the tangent line? Ohundred thousand subscribers over the eight years number of subscribers O hundred thousand subscribers per year Onumber of years Write a sentence of interpretation for the slope of the graph at point P. In 2005, the total number of cellular subscribers was increasing by 50 Xhundred thousand per year. (c) Calculate the percentage rate of change at point P. (Round your answer to three decimal places.) % Interpret the percentage rate of change at point P. In 2005, the total number of cellular subscribers wasSelect-- by approximately % per year.

Trigonometry (MindTap Course List)
10th Edition
ISBN:9781337278461
Author:Ron Larson
Publisher:Ron Larson
Chapter6: Topics In Analytic Geometry
Section6.2: Introduction To Conics: parabolas
Problem 4ECP: Find an equation of the tangent line to the parabola y=3x2 at the point 1,3.

Related questions
Question
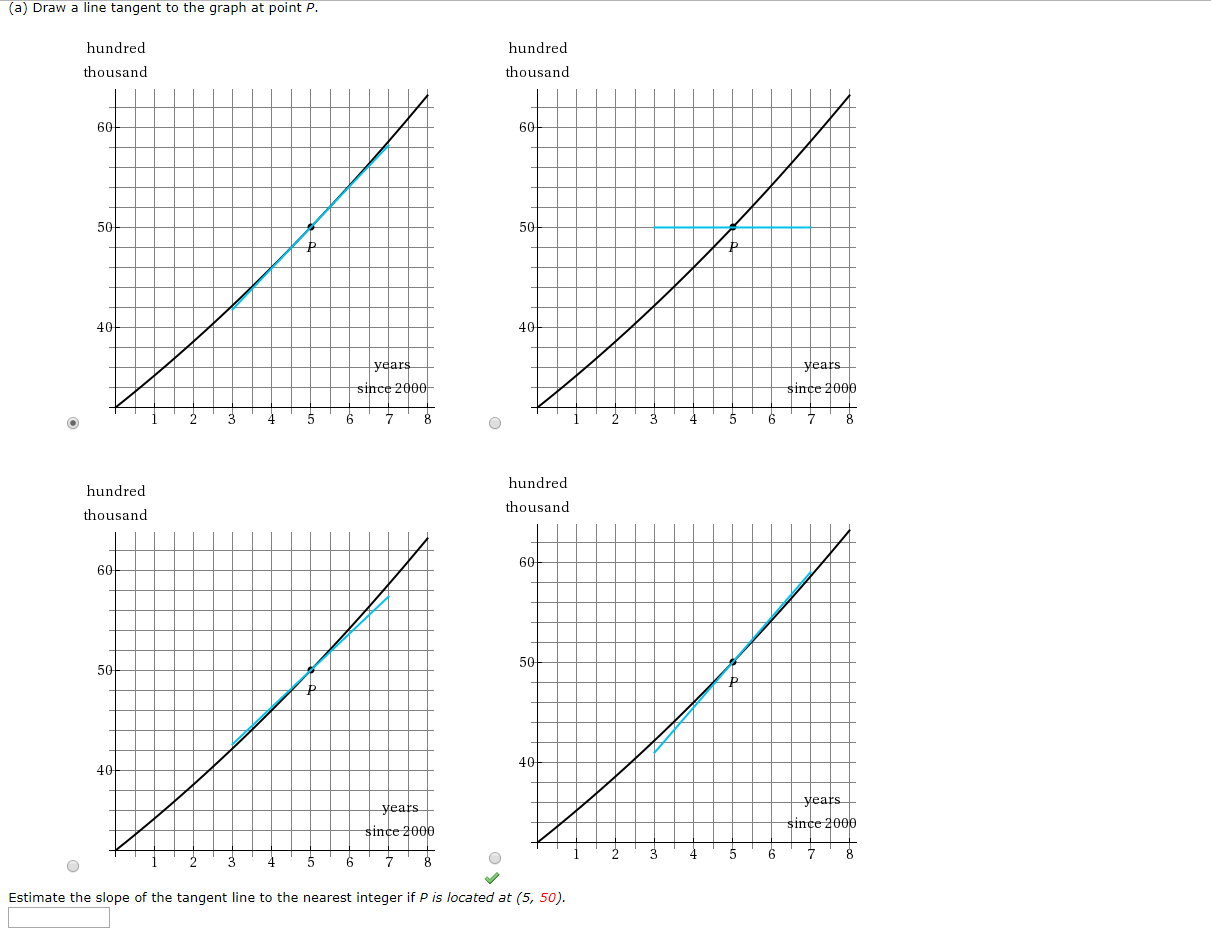
Transcribed Image Text:(a) Draw a line tangent to the graph at point P.
hundred
hundred
thousand
thousand
60
50+
50
40
40
years
vears
since 2000
since 2000
hundred
hundred
thousand
thousand
60
60
50
50
40
40
years
since 2000
years
since 2000
8
7
Estimate the slope of the tangent line to the nearest integer if P is located at (5, 50).
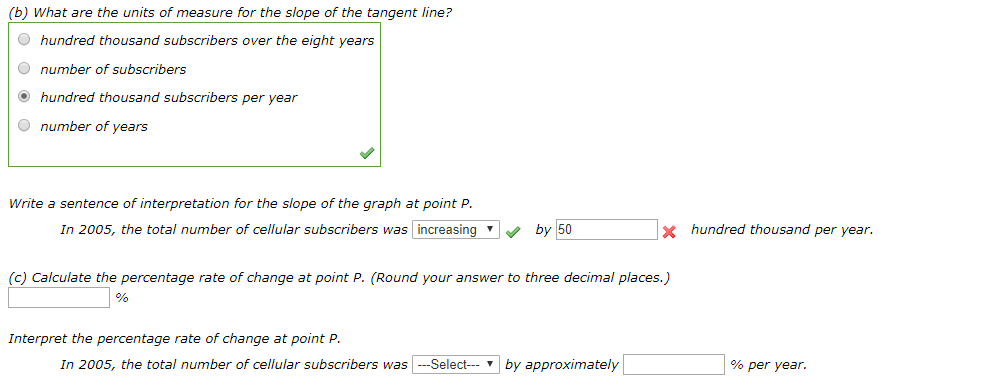
Transcribed Image Text:(b) What are the units of measure for the slope of the tangent line?
Ohundred thousand subscribers over the eight years
number of subscribers
O hundred thousand subscribers per year
Onumber of years
Write a sentence of interpretation for the slope of the graph at point P.
In 2005, the total number of cellular subscribers was increasing
by 50
Xhundred thousand per year.
(c) Calculate the percentage rate of change at point P. (Round your answer to three decimal places.)
%
Interpret the percentage rate of change at point P.
In 2005, the total number of cellular subscribers wasSelect-- by approximately
% per year.
Expert Solution
This question has been solved!
Explore an expertly crafted, step-by-step solution for a thorough understanding of key concepts.

This is a popular solution!

Trending now
This is a popular solution!

Step by step
Solved in 3 steps with 3 images

Recommended textbooks for you
Trigonometry (MindTap Course List)
Trigonometry
ISBN:
9781337278461
Author:
Ron Larson
Publisher:
Cengage Learning

Algebra & Trigonometry with Analytic Geometry
Algebra
ISBN:
9781133382119
Author:
Swokowski
Publisher:
Cengage
Trigonometry (MindTap Course List)
Trigonometry
ISBN:
9781337278461
Author:
Ron Larson
Publisher:
Cengage Learning
Algebra & Trigonometry with Analytic Geometry
Algebra
ISBN:
9781133382119
Author:
Swokowski
Publisher:
Cengage