(a) Draw tangent lines for 1982, 1990, 1995, and 2000. Estimate their slopes. Record the slopes. f(t) gallons |f(t) gallons 700- 700 600 44 10 600 \1982 13 1982 2000 13 1.5 1990 1995 2000 15 1.5 t years 16 1990 1995 t years /19 18 500 since 1970 500 since 1970 10 20 30 10 20 30 f(t) gallons f(t) gallons 700 700- 600- 600- - 40 1982 \1982 5 2000 28 2000 44 1990 1995 1990 1995 5 16 -3 13 8. t years t years 500 500- siņce 1970 siņce 1970 10 20 30 10 20 30 1982 f'(12) X gallons per year 1990 f'(20) = gallons per year 1995 f'(25) = gallons per year 2000 f'(30) gallons per year (b) Use the information in part (a) to sketch a rate-of-change graph for the average annual fuel consumption. 가f(t) gallons 가f(t) gallons per year per year 10 30 10 20 30 t years t years since 1970 since 1970 -7 -7 o-23 o-23 23 |f'(t) gallons 23 f'(t) gallons per year per year 가 10 20 30 t years -가 since 1970 10 20 30 t years since 1970 0-가
(a) Draw tangent lines for 1982, 1990, 1995, and 2000. Estimate their slopes. Record the slopes. f(t) gallons |f(t) gallons 700- 700 600 44 10 600 \1982 13 1982 2000 13 1.5 1990 1995 2000 15 1.5 t years 16 1990 1995 t years /19 18 500 since 1970 500 since 1970 10 20 30 10 20 30 f(t) gallons f(t) gallons 700 700- 600- 600- - 40 1982 \1982 5 2000 28 2000 44 1990 1995 1990 1995 5 16 -3 13 8. t years t years 500 500- siņce 1970 siņce 1970 10 20 30 10 20 30 1982 f'(12) X gallons per year 1990 f'(20) = gallons per year 1995 f'(25) = gallons per year 2000 f'(30) gallons per year (b) Use the information in part (a) to sketch a rate-of-change graph for the average annual fuel consumption. 가f(t) gallons 가f(t) gallons per year per year 10 30 10 20 30 t years t years since 1970 since 1970 -7 -7 o-23 o-23 23 |f'(t) gallons 23 f'(t) gallons per year per year 가 10 20 30 t years -가 since 1970 10 20 30 t years since 1970 0-가

Algebra & Trigonometry with Analytic Geometry
13th Edition
ISBN:9781133382119
Author:Swokowski
Publisher:Swokowski
Chapter3: Functions And Graphs
Section3.3: Lines
Problem 44E

Related questions
Question
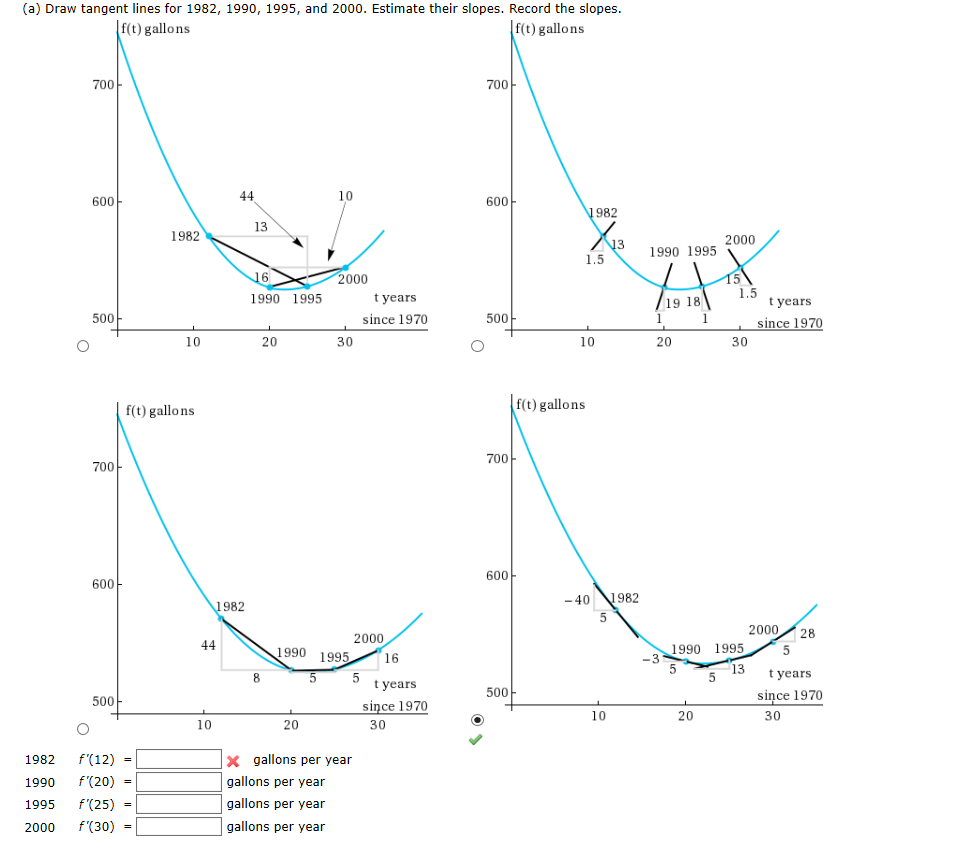
Transcribed Image Text:(a) Draw tangent lines for 1982, 1990, 1995, and 2000. Estimate their slopes. Record the slopes.
f(t) gallons
|f(t) gallons
700-
700
600
44
10
600
\1982
13
1982
2000
13
1.5
1990 1995
2000
15
1.5
t years
16
1990 1995
t years
/19 18
500
since 1970
500
since 1970
10
20
30
10
20
30
f(t) gallons
f(t) gallons
700
700-
600-
600-
- 40 1982
\1982
5
2000
28
2000
44
1990 1995
1990 1995
5
16
-3
13
8.
t years
t years
500
500-
siņce 1970
siņce 1970
10
20
30
10
20
30
1982
f'(12)
X gallons per year
1990
f'(20) =
gallons per year
1995
f'(25) =
gallons per year
2000
f'(30)
gallons per year
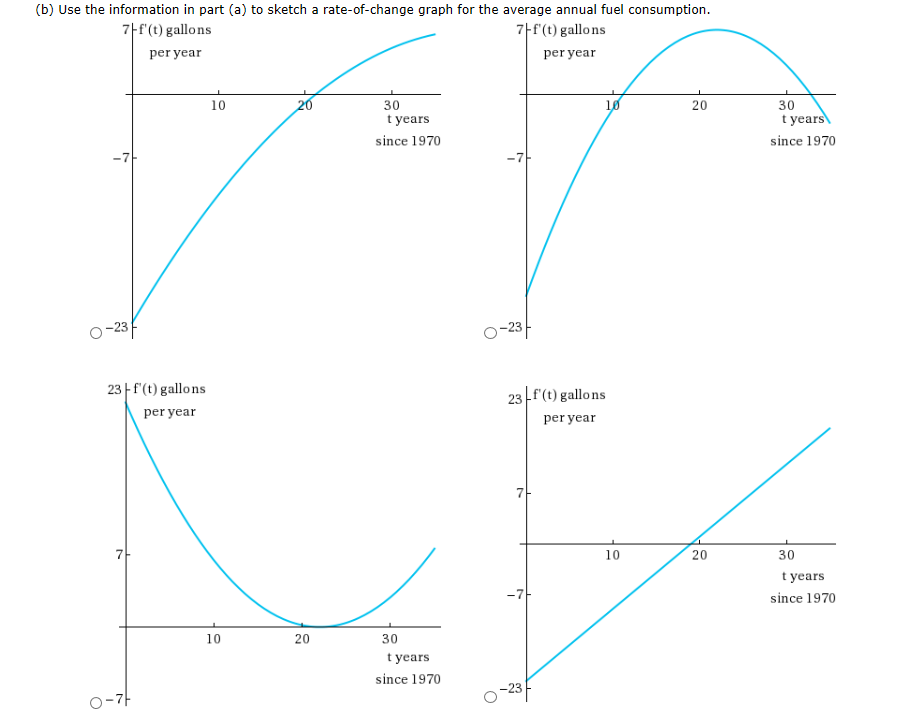
Transcribed Image Text:(b) Use the information in part (a) to sketch a rate-of-change graph for the average annual fuel consumption.
가f(t) gallons
가f(t) gallons
per year
per year
10
30
10
20
30
t years
t years
since 1970
since 1970
-7
-7
o-23
o-23
23 |f'(t) gallons
23 f'(t) gallons
per year
per year
가
10
20
30
t years
-가
since 1970
10
20
30
t years
since 1970
0-가
Expert Solution
This question has been solved!
Explore an expertly crafted, step-by-step solution for a thorough understanding of key concepts.

This is a popular solution!

Trending now
This is a popular solution!

Step by step
Solved in 5 steps with 5 images

Recommended textbooks for you
Algebra & Trigonometry with Analytic Geometry
Algebra
ISBN:
9781133382119
Author:
Swokowski
Publisher:
Cengage

Algebra and Trigonometry (MindTap Course List)
Algebra
ISBN:
9781305071742
Author:
James Stewart, Lothar Redlin, Saleem Watson
Publisher:
Cengage Learning

Algebra & Trigonometry with Analytic Geometry
Algebra
ISBN:
9781133382119
Author:
Swokowski
Publisher:
Cengage
Algebra and Trigonometry (MindTap Course List)
Algebra
ISBN:
9781305071742
Author:
James Stewart, Lothar Redlin, Saleem Watson
Publisher:
Cengage Learning