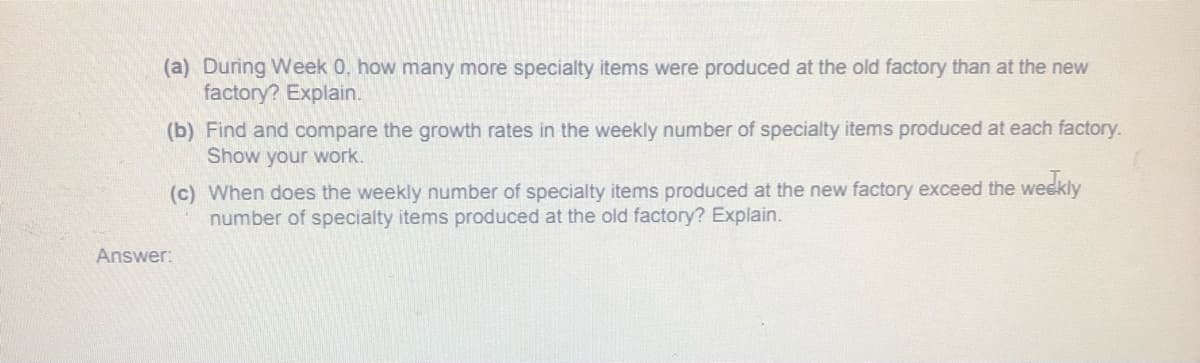
(a) During Week 0, how many more specialty items were produced at the old factory than at the new factory? Explain. (b) Find and compare the growth rates in the weekly number of specialty items produced at each factory. Show your work. (c) When does the weekly number of specialty items produced at the new factory exceed the weekly number of specialty items produced at the old factory? Explain.
(a) During Week 0, how many more specialty items were produced at the old factory than at the new factory? Explain. (b) Find and compare the growth rates in the weekly number of specialty items produced at each factory. Show your work. (c) When does the weekly number of specialty items produced at the new factory exceed the weekly number of specialty items produced at the old factory? Explain.

Trigonometry (MindTap Course List)
8th Edition
ISBN:9781305652224
Author:Charles P. McKeague, Mark D. Turner
Publisher:Charles P. McKeague, Mark D. Turner
ChapterA: Appendix: Review Topics
SectionA.3: Introduction To Functions
Problem 29PS: Suppose you have a job that pays $8.50 per hour and you work anywhere from 10 to 40 hours per week....

Related questions

Question
Transcribed Image Text:(a) During Week 0, how many more specialty items were produced at the old factory than at the new
factory? Explain.
(b) Find and compare the growth rates in the weekly number of specialty items produced at each factory.
Show your work.
(c) When does the weekly number of specialty items produced at the new factory exceed the weekly
number of specialty items produced at the old factory? Explain.
Answer:
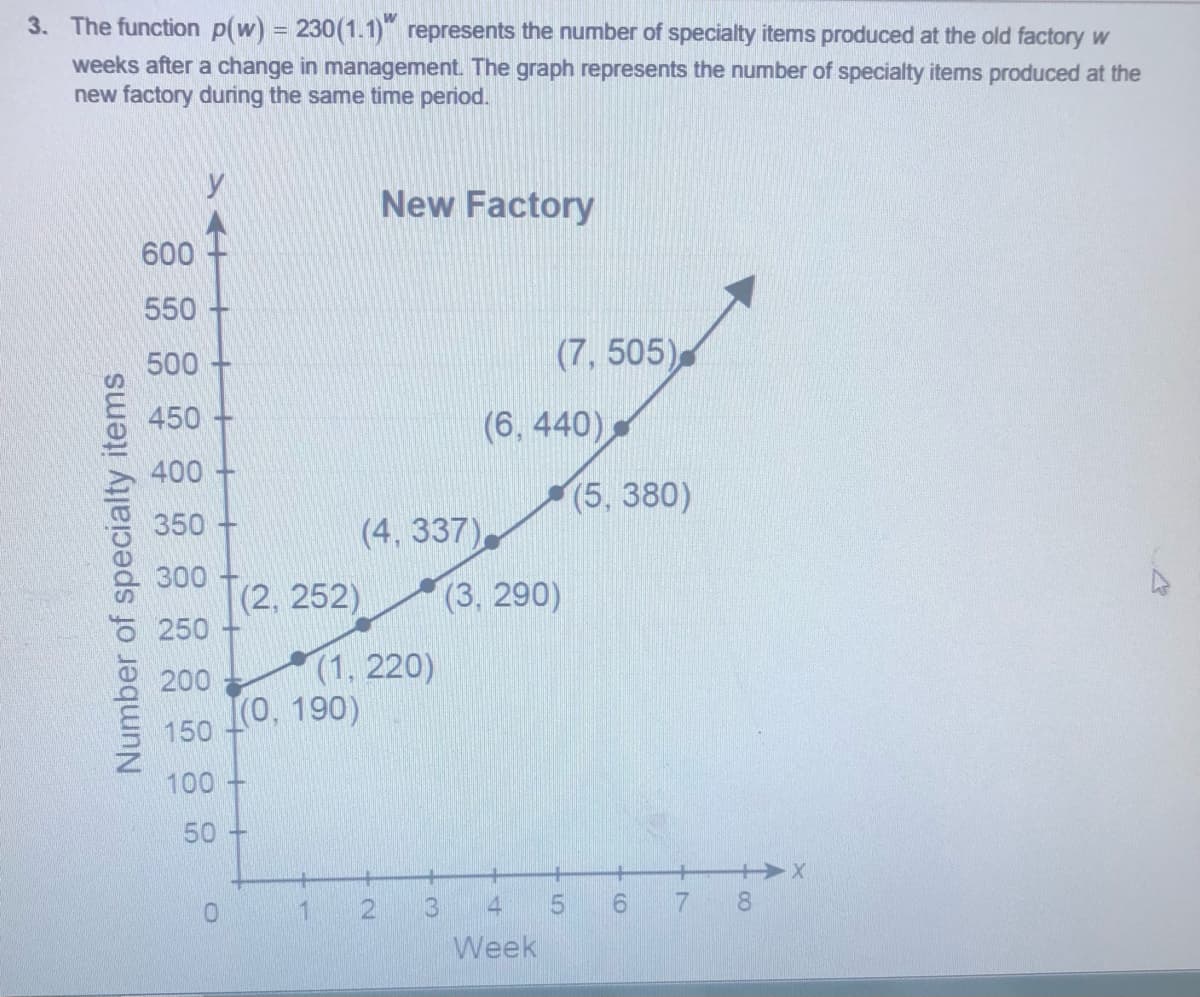
Transcribed Image Text:3. The function p(w) = 230(1.1) represents the number of specialty items produced at the old factory w
weeks after a change in management. The graph represents the number of specialty items produced at the
new factory during the same time period.
New Factory
600
550+
500
(7, 505)
450
(6, 440)
400
(5, 380)
350
(4, 337),
300
(2, 252)
250
(3, 290)
(1, 220)
[(0, 190)
200
150
100 +
50+
++X
2.
3.
4
7 8
Week
Number of specialty items
Expert Solution
This question has been solved!
Explore an expertly crafted, step-by-step solution for a thorough understanding of key concepts.

This is a popular solution!

Trending now
This is a popular solution!

Step by step
Solved in 3 steps

Knowledge Booster


Learn more about
Need a deep-dive on the concept behind this application? Look no further. Learn more about this topic, algebra and related others by exploring similar questions and additional content below.Recommended textbooks for you
Trigonometry (MindTap Course List)
Trigonometry
ISBN:
9781305652224
Author:
Charles P. McKeague, Mark D. Turner
Publisher:
Cengage Learning

Algebra & Trigonometry with Analytic Geometry
Algebra
ISBN:
9781133382119
Author:
Swokowski
Publisher:
Cengage

Glencoe Algebra 1, Student Edition, 9780079039897…
Algebra
ISBN:
9780079039897
Author:
Carter
Publisher:
McGraw Hill
Trigonometry (MindTap Course List)
Trigonometry
ISBN:
9781305652224
Author:
Charles P. McKeague, Mark D. Turner
Publisher:
Cengage Learning
Algebra & Trigonometry with Analytic Geometry
Algebra
ISBN:
9781133382119
Author:
Swokowski
Publisher:
Cengage
Glencoe Algebra 1, Student Edition, 9780079039897…
Algebra
ISBN:
9780079039897
Author:
Carter
Publisher:
McGraw Hill


Big Ideas Math A Bridge To Success Algebra 1: Stu…
Algebra
ISBN:
9781680331141
Author:
HOUGHTON MIFFLIN HARCOURT
Publisher:
Houghton Mifflin Harcourt

Algebra for College Students
Algebra
ISBN:
9781285195780
Author:
Jerome E. Kaufmann, Karen L. Schwitters
Publisher:
Cengage Learning