A football statistician is interested to see if the two teams have significantly different weights. What is the hypothesis test to be done? (Use 4, - Hz, where 4, is Team B and u, is Team A.) O Ho: Hy = Hz Ho: H = = 0.5 H1: H, = 0.5 O Ho: Hq = Hz O Hoi Hq> Hz B (b) What is the mean difference in weight (in pounds) between the two teams? (Use 4 - 42, where 4, is Team B and u, is Team A.) Ibs Which team, on average, had the higher weight? O Team A Team B O not enough information B (c) Assume the population variances for the two samples are equal (then df = n1 + n2 - 2). Find the t-statistic, critical value, and the p-value associated with the hypothesis test at the 99% confidence level. (Round your answers to three decimal places.) t-statistic critical value p-value B (d) At a 99% confidence level, should the null hypothesis be rejected or not? Fill in the blanks. The null hypothesis should -Select- . The mean weights between the two teams --Select-- V significantly different at the 99%% confidence level.
A football statistician is interested to see if the two teams have significantly different weights. What is the hypothesis test to be done? (Use 4, - Hz, where 4, is Team B and u, is Team A.) O Ho: Hy = Hz Ho: H = = 0.5 H1: H, = 0.5 O Ho: Hq = Hz O Hoi Hq> Hz B (b) What is the mean difference in weight (in pounds) between the two teams? (Use 4 - 42, where 4, is Team B and u, is Team A.) Ibs Which team, on average, had the higher weight? O Team A Team B O not enough information B (c) Assume the population variances for the two samples are equal (then df = n1 + n2 - 2). Find the t-statistic, critical value, and the p-value associated with the hypothesis test at the 99% confidence level. (Round your answers to three decimal places.) t-statistic critical value p-value B (d) At a 99% confidence level, should the null hypothesis be rejected or not? Fill in the blanks. The null hypothesis should -Select- . The mean weights between the two teams --Select-- V significantly different at the 99%% confidence level.

MATLAB: An Introduction with Applications
6th Edition
ISBN:9781119256830
Author:Amos Gilat
Publisher:Amos Gilat
Chapter1: Starting With Matlab
Section: Chapter Questions
Problem 1P

Related questions
Topic Video
Question
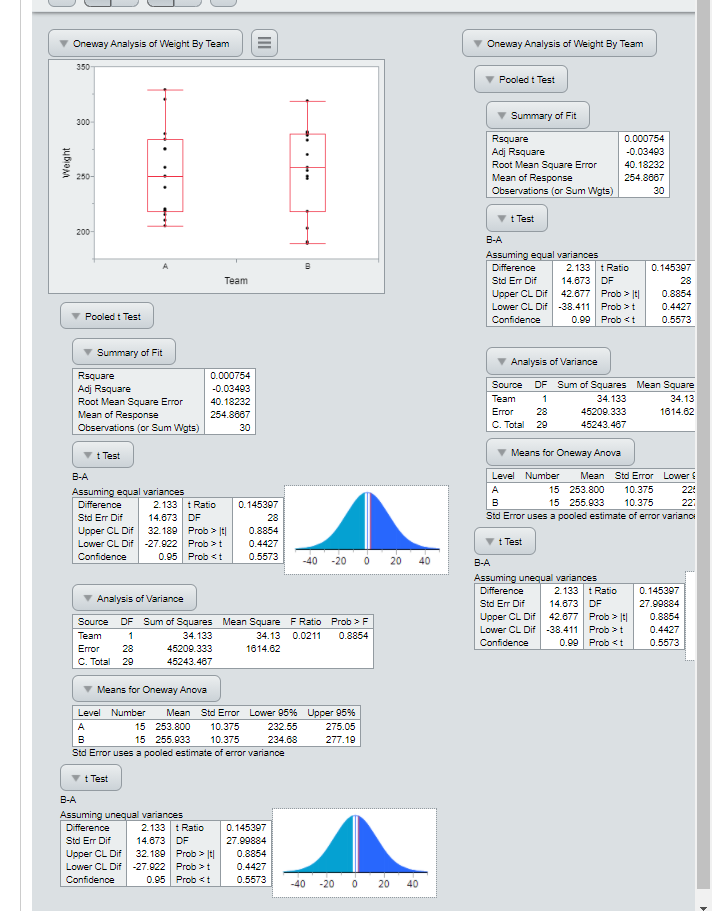
Transcribed Image Text:Oneway Analysis of Weight By Team
Oneway Analysis of Weight By Team
350
Pooled t Test
Summary of Fit
300
Rsquare
0.000754
Adj Rsquare
Root Mean Square Error
Mean of Response
-0.03493
40.18232
250-
254.8887
Observations (or Sum Wgts)
30
t Test
200-
B-A
Assuming equal variances
Difference
2.133 t Ratio
14.673
42.677 Prob > IE|
0.145397
Тeam
Std Err Dif
DF
28
Upper CL Dif
0.8854
Lower CL Dif -38.411 Prob >t
0.4427
Pooled t Test
Confidence
0.99 Prob < t
0.5573
Summary of Fit
Analysis of Variance
Rsquare
0.000754
Adj Rsquare
Root Mean Square Error
Mean of Response
Source DF Sum of Squares Mean Square
Тeam
-0.03493
40.18232
1
34.133
34.13
254.8887
Error
28
45209.333
1614.62
Observations (or Sum Wgts)
30
C. Total
29
45243.467
t Test
Means for Oneway Anova
В-А
Level Number
Mean Std Error Lower {
A
15 253.800
10.375
22
Assuming equal variances
2.133 t Ratio
14.673 DF
32.189 Prob > |t|
Difference
0.145307
15 255.933
10.375
227
Std Err Dif
28
Std Error uses a pooled estimate of error variano
Upper CL Dif
0.8854
Lower CL Dif -27.922 Prob >t
0.4427
t Test
Confidence
0.95 Prob <t
0.5573
-40 -20 0 20
B-A
Assuming unequal variances
2.133 t Ratio
14.673 DF
42.677 Prob > ||
Difference
0.145397
Analysis of Variance
Std Err Dif
27.99884
Upper CL Dif
Lower CL Dif -38.411
Confidence
0.8854
Source DF Sum of Squares Mean Square FRatio Prob >F
Prob >t
0.4427
Тeam
1
34.133
34.13
0.0211
0.8854
0.99 Prob <t
0.5573
Error
28
45209.333
1614.62
C. Total 29
45243.467
Means for Oneway Anova
Level Number
Mean
Std Error Lower 95% Upper 95%
A
15 253.800
10.375
232.55
275.05
15 255.933
10.375
234.68
277.19
Std Error uses a pooled estimate of error variance
t Test
В-А
Assuming unequal variances
2.133 t Ratio
14.673 DF
32.189 Prob > |t|
Difference
0.145397
Std Err Dif
27.99884
Upper CL Dif
0.8854
Lower CL Dif -27.922 Prob >t
0.4427
Confidence
0.95 Prob <t
0.5573
-40
-20
20
40
Weight
II
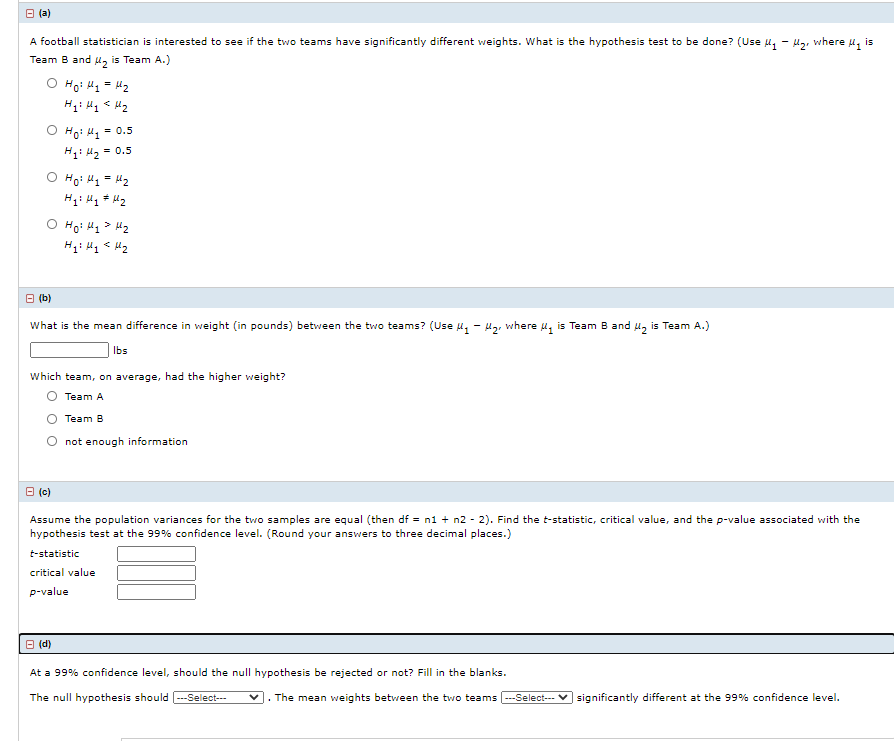
Transcribed Image Text:O (a)
A football statistician is interested to see if the two teams have significantly different weights. What is the hypothesis test to be done? (Use l, - ug, where u, is
Team B and u, is Team A.)
O Hoi Hq = Hz
= 0.5
= 0.5
Ho: My = H2
O Hoi Hq> Hz
O (b)
What is the mean difference in weight (in pounds) between the two teams? (Use u, - ug, where u, is Team B and u, is Team A.)
Ibs
Which team, on average, had the higher weight?
O Team A
O Team B
O not enough information
e (c)
Assume the population variances for the two samples are equal (then df = n1 + n2 - 2). Find the t-statistic, critical value, and the p-value associated with the
hypothesis test at the 99% confidence level. (Round your answers to three decimal places.)
t-statistic
critical value
p-value
B (d)
At a 99% confidence level, should the null hypothesis be rejected or not? Fill in the blanks.
The null hypothesis should --Select---
. The mean weights between the two teams
---Select--- V significantly different at the 99% confidence level.
Expert Solution
This question has been solved!
Explore an expertly crafted, step-by-step solution for a thorough understanding of key concepts.

This is a popular solution!

Trending now
This is a popular solution!

Step by step
Solved in 3 steps with 1 images

Knowledge Booster


Learn more about
Need a deep-dive on the concept behind this application? Look no further. Learn more about this topic, statistics and related others by exploring similar questions and additional content below.Recommended textbooks for you
MATLAB: An Introduction with Applications
Statistics
ISBN:
9781119256830
Author:
Amos Gilat
Publisher:
John Wiley & Sons Inc

Probability and Statistics for Engineering and th…
Statistics
ISBN:
9781305251809
Author:
Jay L. Devore
Publisher:
Cengage Learning

Statistics for The Behavioral Sciences (MindTap C…
Statistics
ISBN:
9781305504912
Author:
Frederick J Gravetter, Larry B. Wallnau
Publisher:
Cengage Learning
MATLAB: An Introduction with Applications
Statistics
ISBN:
9781119256830
Author:
Amos Gilat
Publisher:
John Wiley & Sons Inc
Probability and Statistics for Engineering and th…
Statistics
ISBN:
9781305251809
Author:
Jay L. Devore
Publisher:
Cengage Learning
Statistics for The Behavioral Sciences (MindTap C…
Statistics
ISBN:
9781305504912
Author:
Frederick J Gravetter, Larry B. Wallnau
Publisher:
Cengage Learning

Elementary Statistics: Picturing the World (7th E…
Statistics
ISBN:
9780134683416
Author:
Ron Larson, Betsy Farber
Publisher:
PEARSON

The Basic Practice of Statistics
Statistics
ISBN:
9781319042578
Author:
David S. Moore, William I. Notz, Michael A. Fligner
Publisher:
W. H. Freeman

Introduction to the Practice of Statistics
Statistics
ISBN:
9781319013387
Author:
David S. Moore, George P. McCabe, Bruce A. Craig
Publisher:
W. H. Freeman